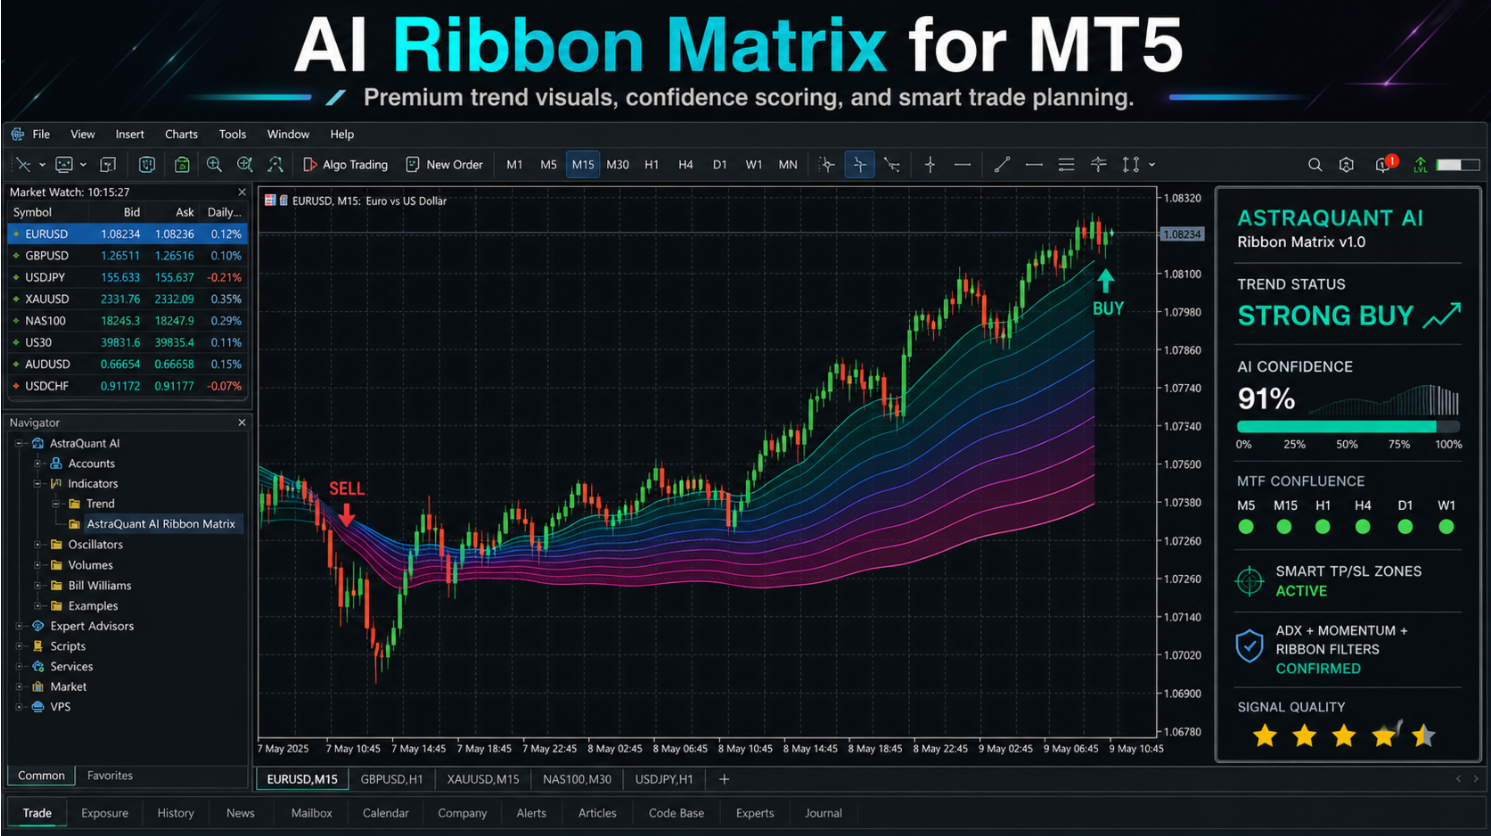
AstraQuant AI Ribbon Matrix is listed through the official MQL5 seller catalog and should be evaluated with a real trading process, not hype. This guide explains where the product fits, what to check before use, and how to review results like a serious MT5 trader.
No product can remove risk from trading. The value comes from combining the tool with clear rules, conservative sizing, screenshot review, and a willingness to skip weak market conditions.
What the Ribbon Actually Shows
AstraQuant AI Ribbon Matrix is built around trend structure. An EMA ribbon can show whether moving averages are expanding, compressing, sloping, or crossing. Those details help a trader understand whether the market has direction or is stuck in indecision.
The ribbon should not be treated as a decoration. Its spacing and slope matter. A wide, clean ribbon with price respecting pullbacks is different from a flat ribbon that flips color in a range.
Reading Expansion and Compression
Ribbon expansion usually means momentum is building. If price pulls back toward the ribbon and then continues, the trend may still be healthy. Compression means the market is losing direction or preparing for a new move. During compression, signals deserve more caution.
A common mistake is entering as soon as the ribbon changes. A better approach is to check whether price has room to move, whether the higher timeframe agrees, and whether the stop loss can be placed logically.
Pullback Quality
The best trend-following entries often come after a controlled pullback, not after a vertical candle. A good pullback respects the ribbon area, slows down near structure, and then shows continuation pressure. A bad pullback slices through the ribbon repeatedly and leaves the trend unclear.
AstraQuant AI Ribbon Matrix can help traders wait for cleaner pullbacks. This is valuable because chasing late momentum usually creates poor reward-to-risk.
Multi-Timeframe Alignment
Use a higher timeframe to define the main direction, then use a lower timeframe for timing. For example, H1 can provide trend bias while M15 gives the entry structure. If the lower timeframe signal fights the higher timeframe ribbon, reduce confidence or skip the trade.
This approach also lowers overtrading. The trader no longer treats every small signal as important. Only signals that agree with the broader market receive attention.
Best and Worst Conditions
The indicator is strongest when the market trends with visible rhythm: impulse, pullback, continuation. It is weakest in tight sideways ranges, low-liquidity periods, and news spikes where moving averages react after price has already moved.
If the ribbon is flat, tangled, or changing direction too often, the best action may be to wait. A ribbon tool becomes more powerful when the trader accepts that some market phases are not worth trading.
How to Review Performance
After several sessions, collect examples of clean trend entries, late entries, and skipped signals. Mark the ribbon shape before entry. This will show whether your best trades came from expansion, pullback retests, or higher-timeframe alignment.
The goal is to build a practical trend system around the indicator. AstraQuant AI Ribbon Matrix should help create fewer, cleaner decisions instead of adding more noise to the chart.
Entry Timing With Ribbon Distance
Ribbon distance is an important filter. If price is too far away from the ribbon, the signal may already be late. A better plan is to wait for price to come back toward the average area, form a controlled pullback, and then continue with the trend. This keeps risk smaller and makes the stop loss easier to place.
Traders should also compare the entry candle with recent volatility. If the candle is unusually large, entering immediately can create poor reward-to-risk. Waiting for a retest may reduce missed trades, but it also protects the account from emotional chasing.
Before You Buy on MQL5
Use the official seller list to confirm current price, screenshots, demo availability, comments, supported platform, and version history. Seller-list links are more reliable than direct product URLs because marketplace pages and product details can change over time.
Test carefully, start conservatively, and judge the product from repeatable behavior rather than one winning screenshot.
Frequently Asked Questions
What does AstraQuant AI Ribbon Matrix help with?
It helps traders read EMA ribbon structure, trend bias, pullback quality, and market alignment inside MT5.
Is it only for trend trading?
It is strongest in directional markets. Range conditions require more caution because ribbons can compress and flip often.
How do I avoid late entries?
Wait for pullbacks and avoid chasing signals after price has already moved far away from the ribbon.
View AstraQuant AI Ribbon Matrix on MQL5
Open the official seller catalog for current pricing, screenshots, comments, demos, and installation options.
Open Seller List ->