I'm going to be honest — I got tired of every "free" indicator on MQL5 being either a stripped-down demo with locked features or something that looks great on screenshots but repaints every signal the moment you load it on a live chart. So I built one myself and gave it away for free. No catch.
AlgoMatrix HMA Cloud uses a dual Hull Moving Average system to create a dynamic cloud that shows trend direction at a glance. When the trend is strong, you get clean entry signals with exact TP and SL levels. When the market is flat, the built-in filters keep you out of bad trades. That's the entire concept — and it works better than half the paid indicators I've tested.
This guide covers everything: what makes HMA different from EMA, how the cloud system generates signals, how the flat market filter saves you from choppy price action, and the exact settings I recommend for different instruments and timeframes.
What Is the Hull Moving Average and Why Use It?
Most traders start with Simple Moving Averages, graduate to Exponential Moving Averages, and stop there. The problem with both SMA and EMA is lag. By the time a 20 EMA confirms a trend change, price has already moved a significant distance from the optimal entry point. You're always late.
Alan Hull solved this in 2005 with the Hull Moving Average. The math behind it is elegant — it uses weighted moving averages of different periods combined with a square root period calculation to dramatically reduce lag while maintaining smoothness. In practical terms, a 20-period HMA responds to trend changes about 2-3 candles earlier than a 20-period EMA.
That difference might sound small on paper. In live trading, it's the difference between catching the start of a move and chasing it after the first pullback already happened.
Why a Dual HMA System Instead of a Single Line?
A single HMA line gives you direction — price above the line means bullish, below means bearish. That's useful but limited. A dual HMA system with a fast period (default 9) and a slow period (default 21) gives you something much more powerful: a cloud.
When the fast HMA is above the slow HMA, the area between them fills with a bullish color. When the fast drops below the slow, the fill switches to bearish. The width of this cloud tells you trend strength — a wide cloud means the fast and slow HMAs are diverging, indicating strong momentum. A narrow cloud means they're converging, warning you that the trend might be losing steam.
This cloud behavior gives you three pieces of information simultaneously: trend direction, trend strength, and potential reversal warnings. No single moving average line can do that.
How the HMA Cloud Generates Buy and Sell Signals
The signal logic is deliberately simple and that's what makes it reliable. There are only two conditions for a buy signal and two for a sell signal.
A buy signal fires when the candle close breaks above the HMA cloud from below — meaning both the fast and slow HMA are now below the current price. This confirms that both short-term and medium-term momentum have shifted bullish.
A sell signal fires when the candle close breaks below the HMA cloud from above — both HMAs are now above price, confirming bearish momentum on both timeframes built into the indicator.
The Trade Lifecycle System
This is where HMA Cloud separates itself from every other free indicator. Most indicators spam arrows on every bar that meets their condition. You end up with 15 buy arrows during a bullish trend, which is useless for actual trading.
HMA Cloud uses a complete trade lifecycle. Once a buy signal fires, the indicator enters a "long trade active" state. While this state is active, no new buy or sell signals will appear. The indicator waits until one of three events happens: an exit signal (price crosses back through the cloud), the stop loss level is hit, or TP3 is reached. Only then does it start looking for the next trade.
The result? Clean charts with one entry per move, exactly like a real trader would execute. No signal spam, no confusion about which arrow is the "real" one.
Three TP/SL Modes — Choose What Fits Your Style
Every signal comes with a stop loss and three take profit levels. But not every trader wants the same type of TP/SL calculation, so the indicator offers three modes.
ATR-Based Mode (Default)
This is what I recommend for most traders. The stop loss is set at 1.5× ATR(14) from entry, and the three take profit levels are at 1×, 2×, and 3× ATR. Because ATR adapts to current volatility, your levels automatically adjust when the market gets quiet or volatile. You never have to manually recalculate.
On XAUUSD during London session when ATR might be 15-20 points, your TP1 sits about 15-20 points from entry. During quiet Asian hours when ATR drops to 5-8 points, TP1 contracts to match. The indicator does this calculation on every signal, every time.
Fixed Pips Mode
If you prefer exact numbers, fixed pips mode lets you set specific values for SL, TP1, TP2, and TP3. This is straightforward — your SL is always, say, 200 points and your TP1 is always 300 points regardless of market volatility. Some scalpers prefer this predictability.
Percentage-Based Mode
For traders who think in terms of percentage risk, this mode calculates SL and TP as a percentage of the current price. A 0.5% SL on gold at $3,000 gives you a 15-point stop. At $2,500, it would be 12.5 points. This keeps your risk proportional to the instrument's price level.
The Flat Market Filter — Why It Matters More Than You Think
Here's a stat that might surprise you: in my testing across 6 months of XAUUSD data, roughly 40% of all HMA crossover signals occurred during flat, rangebound markets. And those flat-market signals had a win rate below 35%. They were actively destroying the edge that the strong-trend signals were creating.
That's why the flat market filter exists. It's not optional fluff — it's the difference between a mediocre indicator and a genuinely useful one.
ADX Trend Strength Filter
The ADX (Average Directional Index) measures trend strength on a 0-100 scale. When ADX is below 20, the market is ranging — there's no directional conviction from either side. The HMA Cloud indicator monitors ADX continuously and suppresses all signals when it falls below the threshold.
You can adjust this threshold from the dashboard. For highly volatile instruments like gold, 20 works well. For slower pairs like EURGBP, you might lower it to 15. For crypto, you might raise it to 25 because crypto markets tend to have higher baseline ADX readings.
Cloud Width Filter
The second filter is unique to this indicator. It measures the gap between the fast and slow HMA relative to the ATR value. When this gap is too narrow — meaning the two moving averages are practically on top of each other — there's no clear trend regardless of what ADX says.
Think about it: if your fast HMA (9) and slow HMA (21) are only 2 points apart on a gold chart that moves 30 points per hour, the "crossover" signal is essentially noise. The cloud width filter catches exactly this situation.
Both filters work together. A signal only appears when the ADX confirms trend strength AND the cloud has meaningful width. This double-layer filter is what gives HMA Cloud its reliability.
The Interactive Dashboard — 4 Tabs of Control
Every HMA Cloud feature can be monitored and adjusted directly from the chart through a draggable 4-tab dashboard. No need to right-click, open properties, change a number, click OK, and wait for the indicator to reload. You change settings live, and they apply instantly.
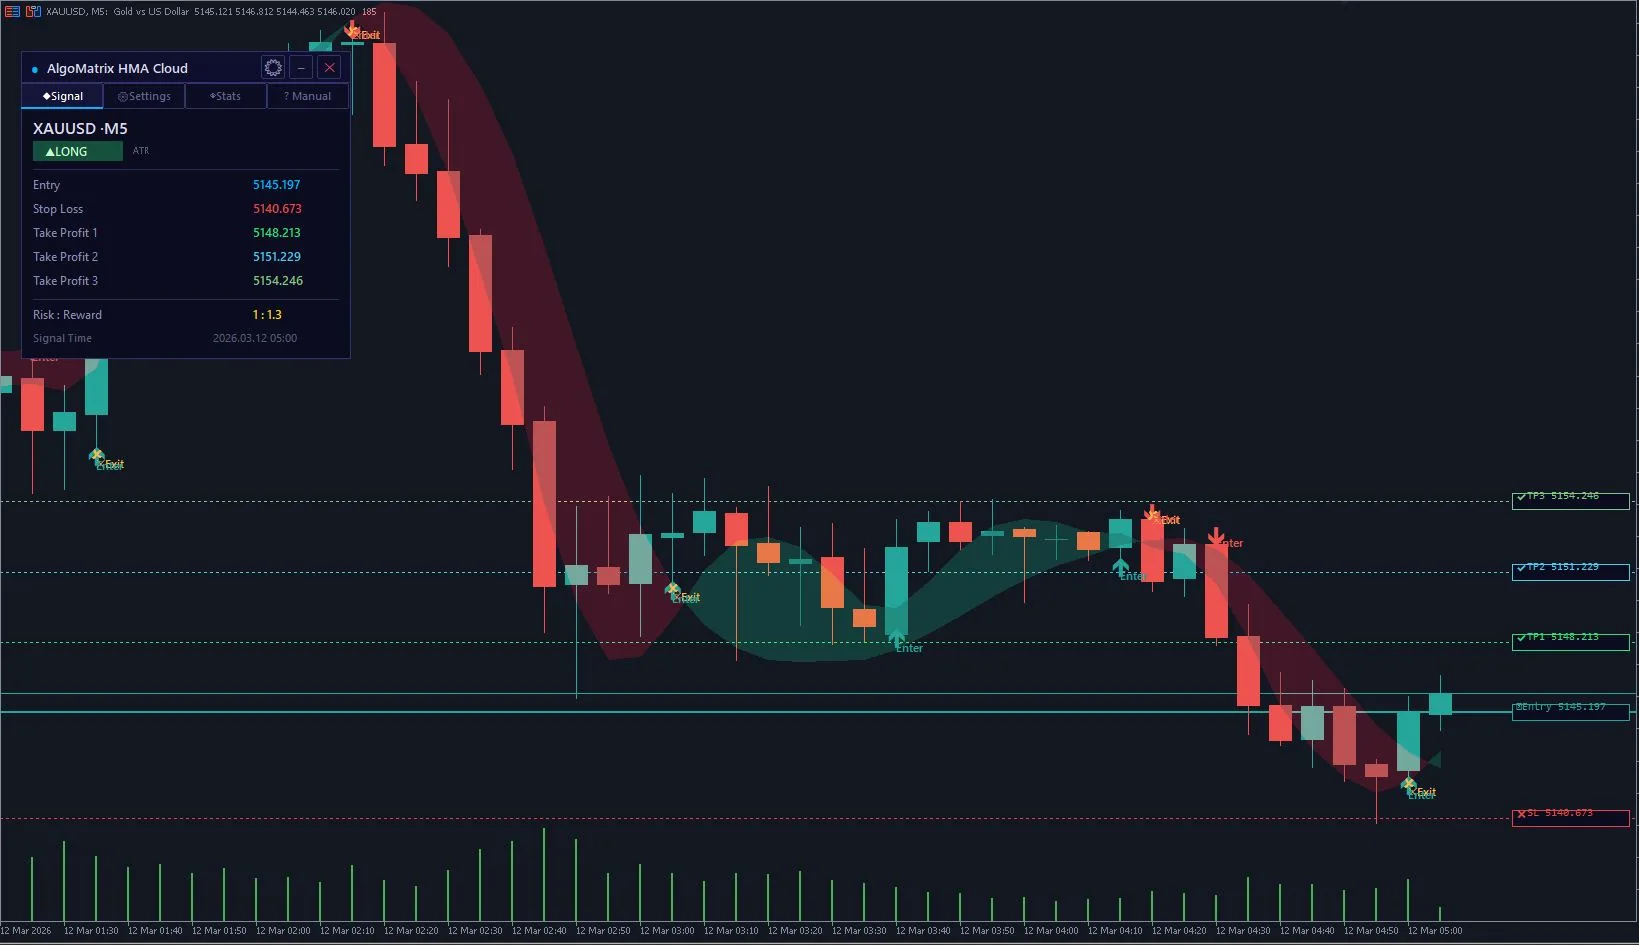
Signal Tab
Shows the current signal direction (Long, Short, or No Signal), entry price, stop loss, TP1, TP2, TP3, risk-reward ratio, and the exact time the signal was generated. Everything you need to take the trade, in one glance.
Settings Tab
Change HMA periods, TP/SL mode, all multiplier values, toggle the ADX filter and cloud width filter, and adjust their thresholds. Every change applies immediately to the chart without reloading the indicator. There's a "Reset Defaults" button if you want to go back to the optimized settings.
Stats Tab
Real-time tracking of total signals generated, buy count, sell count, TP1 hit rate, SL hit rate, and overall win rate displayed with a color-coded progress bar. This lets you evaluate the indicator's performance on any instrument and timeframe without backtesting software.
Manual Tab
A built-in quick reference guide with three pages covering signal logic, TP/SL modes, and filter settings. Useful when you're learning the indicator and don't want to switch to a browser to read documentation.
Recommended Settings by Instrument and Timeframe
The default settings work well for most situations, but here are the adjustments I recommend based on my own testing.
XAUUSD (Gold) on M15-H1
Stick with the defaults — Fast 9, Slow 21, ATR mode with 1.5× SL and 1/2/3× TP multipliers. Gold on M15-H1 trends strongly during London and New York sessions, and the default ADX filter of 20 effectively blocks Asian session noise. This is the combination I use on my own gold charts.
Major Forex Pairs on H1-H4
EURUSD, GBPUSD, and USDJPY on H1 or H4 work great with defaults. For EURGBP and AUDNZD (pairs that range more than trend), increase the ADX threshold to 25 and the cloud width minimum to 1.5× ATR. This is aggressive filtering but necessary for pairs that spend long periods without clear direction.
Indices (US30, NAS100, SPX500) on M15-H1
Indices tend to trend more consistently than forex during market hours. Lower the ADX threshold to 15 and consider using the fast HMA at 7 instead of 9 for quicker entries. The built-in TP/SL in ATR mode handles the higher volatility automatically.
Scalping on M1-M5
Reduce both HMA periods — Fast 5, Slow 13 gives good results on M1-M5 for gold and major pairs. Switch to fixed pips mode with tight values (SL 100 points, TP1 80, TP2 150, TP3 250 on gold). Scalping generates more signals, so the flat market filter becomes even more important — keep both filters enabled.
How I Use HMA Cloud in My Own Trading
I'll share my exact daily process since people ask me this constantly.
I run HMA Cloud on two charts simultaneously: XAUUSD H1 and XAUUSD M15. The H1 chart gives me the directional bias for the session — if the H1 cloud is bullish and expanding, I'm only looking for longs. The M15 chart gives me the actual entry signals.
I only trade during London (07:00-11:00 GMT) and early New York (13:00-16:00 GMT). Outside these windows, even valid signals tend to have poor follow-through because there isn't enough volume to sustain the move.
When a M15 buy signal appears during London session while the H1 cloud is bullish, I enter with 1% risk. I take half off at TP1 and move my stop to breakeven. The remaining half targets TP2 or TP3 depending on whether the H1 cloud is still expanding. If the H1 cloud starts narrowing, I take profit at TP2 regardless.
This simple framework gives me 3-5 trades per week with a win rate around 58%. Not spectacular, but the risk-reward on the trades that hit TP2 or TP3 makes the overall expectancy solidly positive.
Common Mistakes When Using HMA Indicators
After seeing how traders use my indicator for a few months, these are the most common mistakes.
Ignoring the Flat Market Filter
Some traders disable both filters because they "want more signals." This defeats the entire purpose. The filter isn't reducing your opportunities — it's removing the signals that would have lost money. More signals does not mean more profit.
Trading Against Higher Timeframe Direction
A buy signal on M5 while the H1 HMA Cloud is bearish and expanding is a counter-trend trade. These can work, but the probability is significantly lower. Always check at least one timeframe higher before taking a signal.
Moving Stop Loss to Break Even Too Early
TP1 on the ATR mode is designed to be the "quick profit" level — it gets hit frequently. But some traders move their SL to breakeven the moment price moves 5 points in their favor, then get stopped out by normal noise before TP1 is even reached. Trust the ATR-calculated stop loss. It accounts for the instrument's volatility.
Using Too Many Indicators Together
HMA Cloud already incorporates trend direction (dual HMA), trend strength (ADX filter), volatility adaptation (ATR-based TP/SL), and signal filtering (cloud width). Adding RSI, MACD, Bollinger Bands, and three other indicators on top creates analysis paralysis. If anything, add a simple support/resistance or order block tool for context — not more oscillators.
HMA Cloud vs. Paid Trend Indicators — An Honest Comparison
I won't pretend this indicator replaces everything on the market. Here's where HMA Cloud excels and where it doesn't.
Where HMA Cloud Wins
It's genuinely fast. HMA responds to trend changes faster than any EMA-based indicator at the same period settings. The flat market filter is more sophisticated than what most paid indicators offer — many don't have any flat detection at all. And the interactive dashboard with live settings adjustment is a premium feature that no other free indicator provides.
Where Paid Indicators Might Be Better
If you need multi-timeframe scanning across 30+ symbols, something like Multi Scanner Pro does that and HMA Cloud doesn't — it's a single-chart indicator. If you need Smart Money Concepts analysis (order blocks, FVG, liquidity levels), tools like Order Block Sniper Pro are purpose-built for that. HMA Cloud is a trend-following tool, and it's excellent at that specific job.
The point is: HMA Cloud isn't a "limited free version" of a paid indicator. It's a complete, professional tool that does one thing really well — identify trends and generate clean entry signals with proper risk management. If that's what you need, there's no reason to pay for something else.
Installation and First Setup
Setting up HMA Cloud takes about two minutes. Here's the process.
Download the indicator from the MQL5 Market page. In MetaTrader 5, it will automatically install to the correct directory. Open a chart (I recommend XAUUSD H1 for your first test), go to Insert → Indicators → Custom → AlgoMatrix HMA Cloud.
The indicator loads with default settings and the dark chart theme applied. You'll see the HMA cloud drawn on the chart with the 4-tab dashboard in the top-left corner. The cloud should immediately show you the current trend direction.
Before changing any settings, let the indicator run on the default configuration for at least one full trading session. Watch how it generates signals, when the flat market filter activates, and how the TP/SL levels match up with actual price movement. Then adjust from the Settings tab based on what you observe.
Final Thought
I built AlgoMatrix HMA Cloud because I couldn't find a free trend indicator on MT5 that was genuinely complete — not a demo, not repainting, not missing basic features like TP/SL calculation. This is the indicator I wanted to use for my own trend-following trades, and I decided to give it away rather than charge for it.
If you find it useful, leave a rating on the MQL5 page. It costs nothing and helps other traders find the tool. And if you have suggestions for improvements, drop a comment — I read every single one.
Disclaimer: This article describes a free trading indicator for educational purposes. Trading involves significant risk of loss. Past performance does not guarantee future results. Always use proper risk management and only trade with capital you can afford to lose.