← Back to Products
Indicator · Trend Analysis

AlgoMatrix EMA Ribbon Indicator

8 EMAs forming a dynamic cloud that reveals trend direction, strength, and momentum at a glance. Interactive dashboard, multi-timeframe analysis, and signal grading system built in.

AlgoMatrix EMA Ribbon Indicator showing colorful EMA cloud with interactive dashboard on gold chart

Everything You Need from an EMA Indicator

Not just lines on a chart. A complete trend analysis system.

🌈

EMA Ribbon Cloud

8 customizable EMAs (20–200) form a gradient cloud. Expanded ribbon = strong trend. Compressed ribbon = consolidation. Cloud color flips between bullish and bearish automatically.

📊

Interactive Dashboard

On-chart dashboard showing trend direction, signal strength, EMA alignment score, and multi-timeframe status. Color-coded for instant visual assessment without reading individual lines.

🔄

Multi-Timeframe Analysis

View EMA ribbon status from M5, M15, H1, and H4 simultaneously on one chart. When all timeframes align, you have high-confluence confirmation for your trade direction.

Signal Grading System

Each signal is graded by strength: ribbon expansion, EMA order alignment, and momentum. Strong, medium, and weak signals are labeled separately so you can filter for the best setups.

🎯

Dynamic Support & Resistance

Each EMA line acts as dynamic S/R. Price bouncing off the 50 EMA in an uptrend is a pullback entry. The ribbon shows you exactly where the key levels are in real time.

⚙️

Fully Customizable Periods

Change any EMA period, color, line width, or style. Use the default 20–200 setup or configure your preferred periods. Every visual element is adjustable to match your chart preference.

Reading the EMA Ribbon

Step 1: Check the Cloud Color

Green cloud = bullish (shortest EMA on top). Red cloud = bearish (shortest EMA on bottom). This gives you instant trend direction without analyzing individual lines.

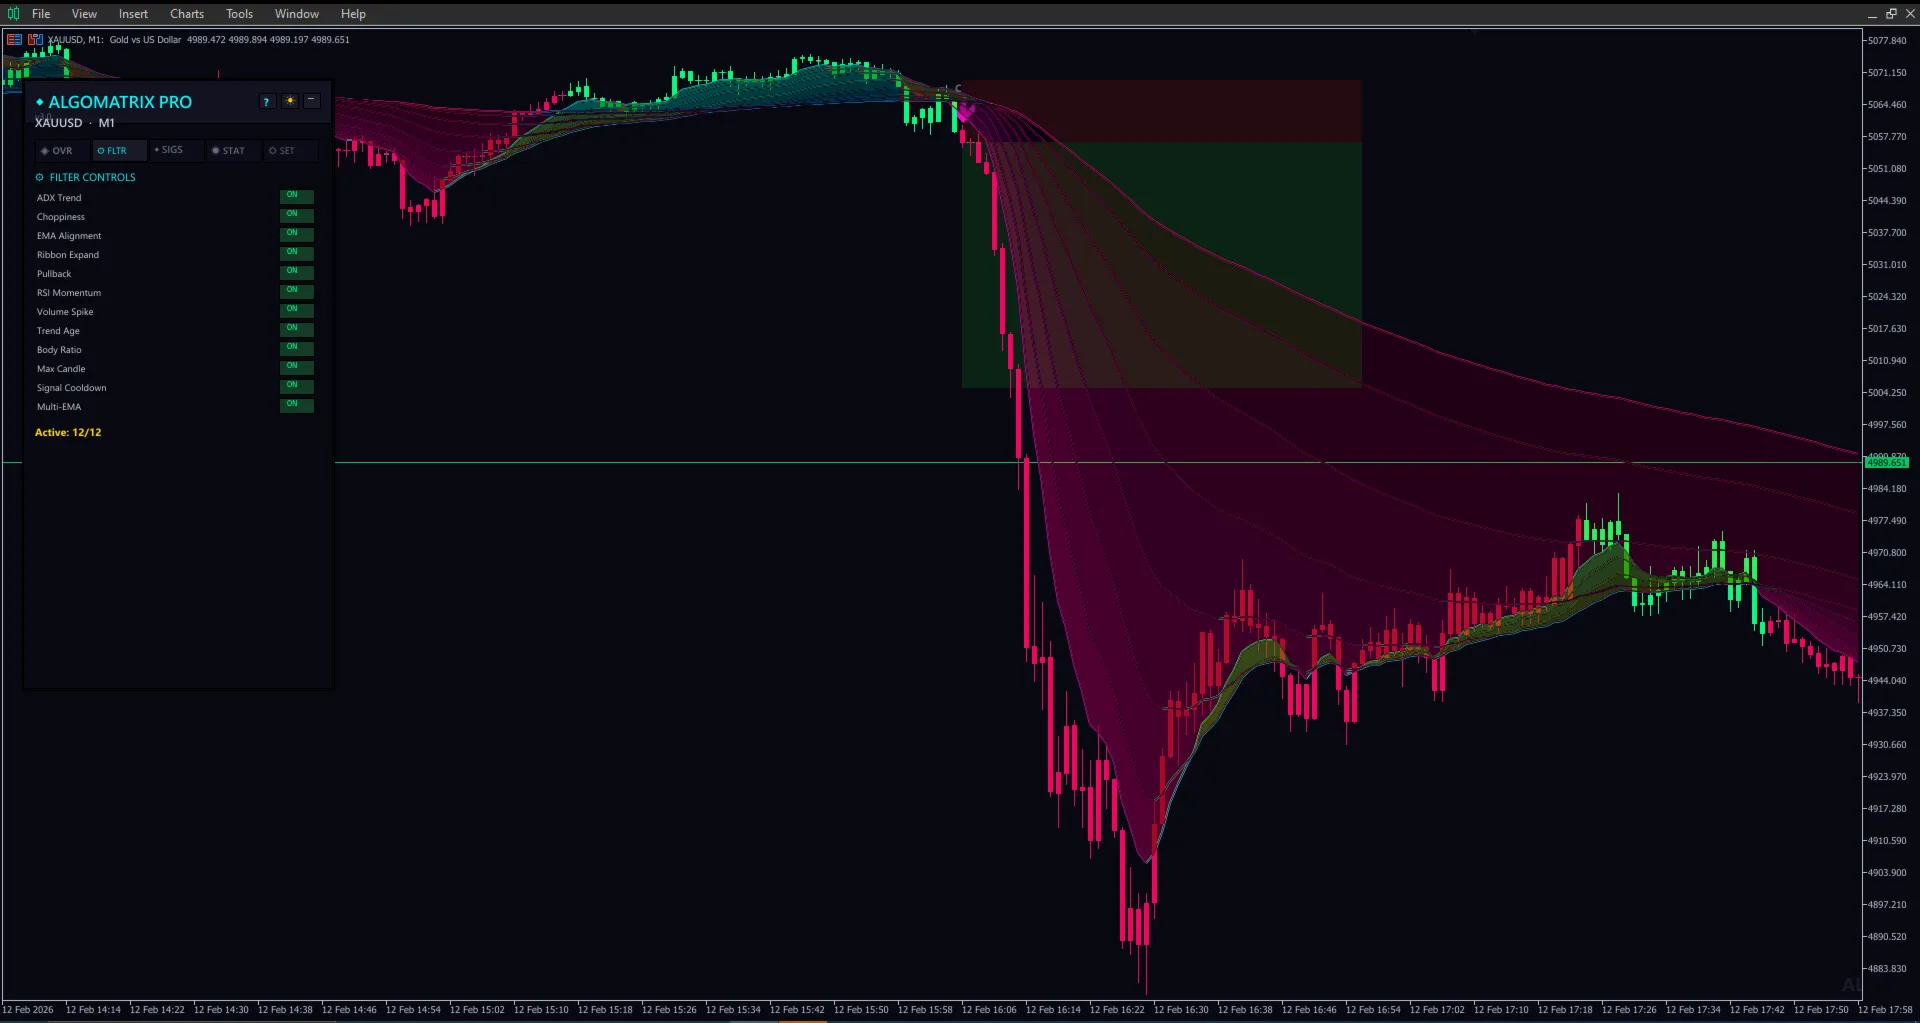
Step 2: Read the Cloud Width

Wide, expanding cloud = strong momentum. Thin, compressed cloud = consolidation or weakening trend. The widest points of the cloud coincide with the strongest trend moves.

Step 3: Use Pullbacks for Entries

In a bullish trend, when price pulls back to touch the upper EMAs (20–50 area) and bounces, that's a pullback buy entry. The cloud acts as dynamic support — enter when price touches and rebounds.

Step 4: Confirm with MTF Dashboard

Before entering, check the dashboard for multi-timeframe alignment. An H1 buy signal confirmed by H4 bullish ribbon has significantly higher probability than H1 alone.

Get AlgoMatrix EMA Ribbon Indicator — $42

Professional EMA ribbon cloud with interactive dashboard and multi-timeframe analysis. The trend indicator that shows direction, strength, and momentum in one view.