My biggest frustration in my first year of gold trading wasn't the losses. I could handle losses — they're part of the game. What drove me crazy was watching a trade I'd exited at +50 pips continue for another 300 pips without me.
I'd enter at the right time, in the right direction, with a good signal. Price would move in my favor. I'd take profit at my target. Then I'd watch, helpless, as gold kept running in a massive wave that lasted the entire London session. I'd left 80% of the move on the table.
This happened over and over until I realized I had an exit problem, not an entry problem. I was good at catching the beginning of moves — but terrible at staying in them when they extended beyond my expectations.
Learning to read momentum waves changed that. Let me show you what I mean.
What Is a Momentum Wave?
A momentum wave is a directional price move driven by genuine buying or selling pressure — not just random tick-by-tick noise. It has specific characteristics that distinguish it from choppy, range-bound price action:
- Consecutive candles in one direction — 3+ candles where the bodies (not just wicks) are mostly in the same direction.
- Increasing candle size — each successive candle in the wave is equal to or larger than the previous. This shows accelerating momentum, not exhaustion.
- Minimal opposing wicks — in a bullish wave, the lower wicks are short. Buyers are absorbing every minor pullback immediately.
- EMA ribbon expansion — the EMAs fan out as the wave progresses, confirming that the move has multi-period momentum behind it.
Not every upward move on gold is a momentum wave. Price can drift up slowly over 20 candles — that's a grind, not a wave. A wave has urgency. You can feel it on the chart. Something has shifted and one side is dominating.
The Three-Wave Pattern on Gold
Gold, particularly during London and early New York session, tends to move in a three-wave pattern that I see again and again:
Wave 1: The Initial Impulse
The first wave typically starts at a structural level — an order block, a session boundary (like the Asian session high), or after a period of compression. It breaks through recent structure and initiates a new directional move.
Wave 1 is usually the hardest to catch in real time because it happens fast and there's limited confirmation. By the time your indicators signal the move, Wave 1 might already be finishing.
What I do: I usually miss Wave 1 or only catch the tail end. That's fine. I'm not trying to pick the exact bottom or top. I use Wave 1 to establish my bias: "OK, the market just made an aggressive move up. I'm now looking for a pullback to enter."
Wave 2: The Correction (Where I Enter)
After Wave 1 exhausts itself, price retraces. This is Wave 2 — the pullback, the correction, the breathing room before the next push. On gold, Wave 2 typically retraces 38-62% of Wave 1 (loosely Fibonacci-based, though I don't measure exact Fib levels).
The key characteristic of a valid Wave 2: it pulls back on decreasing momentum. The correction candles are smaller, wicky, and less decisive than the Wave 1 candles. The EMA ribbon is still expanded — it hasn't compressed.
What I do: This is my entry zone. When price pulls back into the upper portion of the EMA ribbon during a bullish wave sequence, I enter long on a rejection candle. My stop goes below the full ribbon. This is the highest-probability position in the entire wave sequence.
Wave 3: The Extension (Where I Make Money)
Wave 3 is the big one. It's the continuation move after the correction, and on gold, it's often equal to or larger than Wave 1. This is where momentum traders make the bulk of their profits.
Wave 3 starts when price breaks above the Wave 1 high (for bullish scenarios). At that point, traders who were waiting for "confirmation" jump in, stops above the high get triggered (adding fuel), and the institutional flow that started in Wave 1 resumes.
What I do: I'm already in from Wave 2. When Wave 3 begins, I don't add to my position — I manage it. I take partial profit at the Wave 1 high (my TP1), and let the rest ride with an EMA-based trailing stop. If Wave 3 extends significantly, the trail captures the majority of the move.
Reading Momentum Strength in Real Time
The difference between a trade that I hold through the full wave and one I exit early comes down to momentum reading. Here's what I watch:
Candle Body Ratio
I compare the body of each candle (distance between open and close) to its total range (high to low, including wicks). A body ratio above 70% means the candle closed near its extreme — strong momentum. Below 50% means the candle has significant wicks — uncertainty.
During a valid momentum wave, most candles should have body ratios above 60%. When I start seeing multiple candles with ratios below 50%, momentum is fading and the wave is likely near its end.
Volume Confirmation
Rising volume during the wave confirms genuine institutional participation. Falling volume during the wave suggests the move is running on retail momentum alone — which is fragile and likely to reverse.
I don't look at raw volume numbers because forex volume varies by broker. Instead, I compare relative volume: is the current candle's volume higher or lower than the 20-period average? Above average during impulse = healthy. Below average during impulse = suspicious.
Ribbon Acceleration
When the EMA ribbon continues expanding during the wave — meaning the distance between the fastest and slowest EMA is growing — momentum is accelerating. When the ribbon stops expanding and stays parallel, momentum is constant (OK for holding). When the ribbon starts compressing, momentum is dying and I start looking for my exit.
Momentum Fakeouts: How Price Tricks You
Not every strong-looking candle is the start of a momentum wave. Gold is notorious for producing fakeout impulses that look exactly like Wave 1 initiations but then immediately reverse. Here's how I filter them:
Session context. A momentum impulse at 9:00 GMT (London session) is far more likely to be genuine than one at 3:00 GMT (Asian session). I basically ignore any impulse-looking moves during Asian hours unless there's major news.
Higher timeframe alignment. If H1 and H4 are both trending bullish and I see a bullish impulse on M5 — that's probably Wave 1 of a real move. If H1 is bearish but I see a bullish impulse on M5 — that's probably a corrective bounce, not a wave initiation.
Follow-through requirement. I don't commit on the impulse candle itself. I wait for at least one follow-through candle that holds above the impulse candle's midpoint. If the candle after the impulse immediately retraces more than 50%, the impulse was likely a fakeout.
Preceding compression. The most reliable momentum waves emerge from periods of compression — when the market has been quiet and then suddenly breaks. An impulse that comes in the middle of already-volatile price action is less reliable because there's no "coiling spring" effect.
Why Most Traders Exit Too Early
I've thought a lot about why I used to exit winning trades prematurely, and I think it comes down to three psychological factors:
Fear of giving back profit. When you're up 80 pips on gold, every small pullback feels like the beginning of a reversal. Your brain screams "take it before it's gone!" But a 20-30 pip pullback within a momentum wave is completely normal — it's the micro-correction that fuels the next push.
Fixed TP mentality. If your plan says "take profit at 100 pips" and you hit 100 pips, you close — even if the wave clearly has more legs. This is why I moved to a multi-level TP system with trailing. The first partial takes care of the "secure some profit" anxiety, and the trailing runner captures the extension.
Not understanding wave structure. If you don't know what a Wave 3 extension looks like, you'll treat every profit level as a potential reversal point. Understanding that Wave 3 is typically the longest wave helps you hold through the minor pullbacks within it.
Momentum Trading on Different Timeframes
The wave concept works on any timeframe, but the character changes:
M5 waves last 15-45 minutes. They're my bread and butter for scalping. You need to watch the chart during the wave — it moves fast and the exit timing matters.
M15 waves last 1-3 hours. More comfortable pace. Good for traders who can't stare at the screen constantly. Fewer signals per day but each one has more room to run.
H1 waves last 4-12 hours. These are swing trades, not scalps. One or two per week during strong trend weeks. I use these for the "runner" portion of my position — the trail that I set and walk away from.
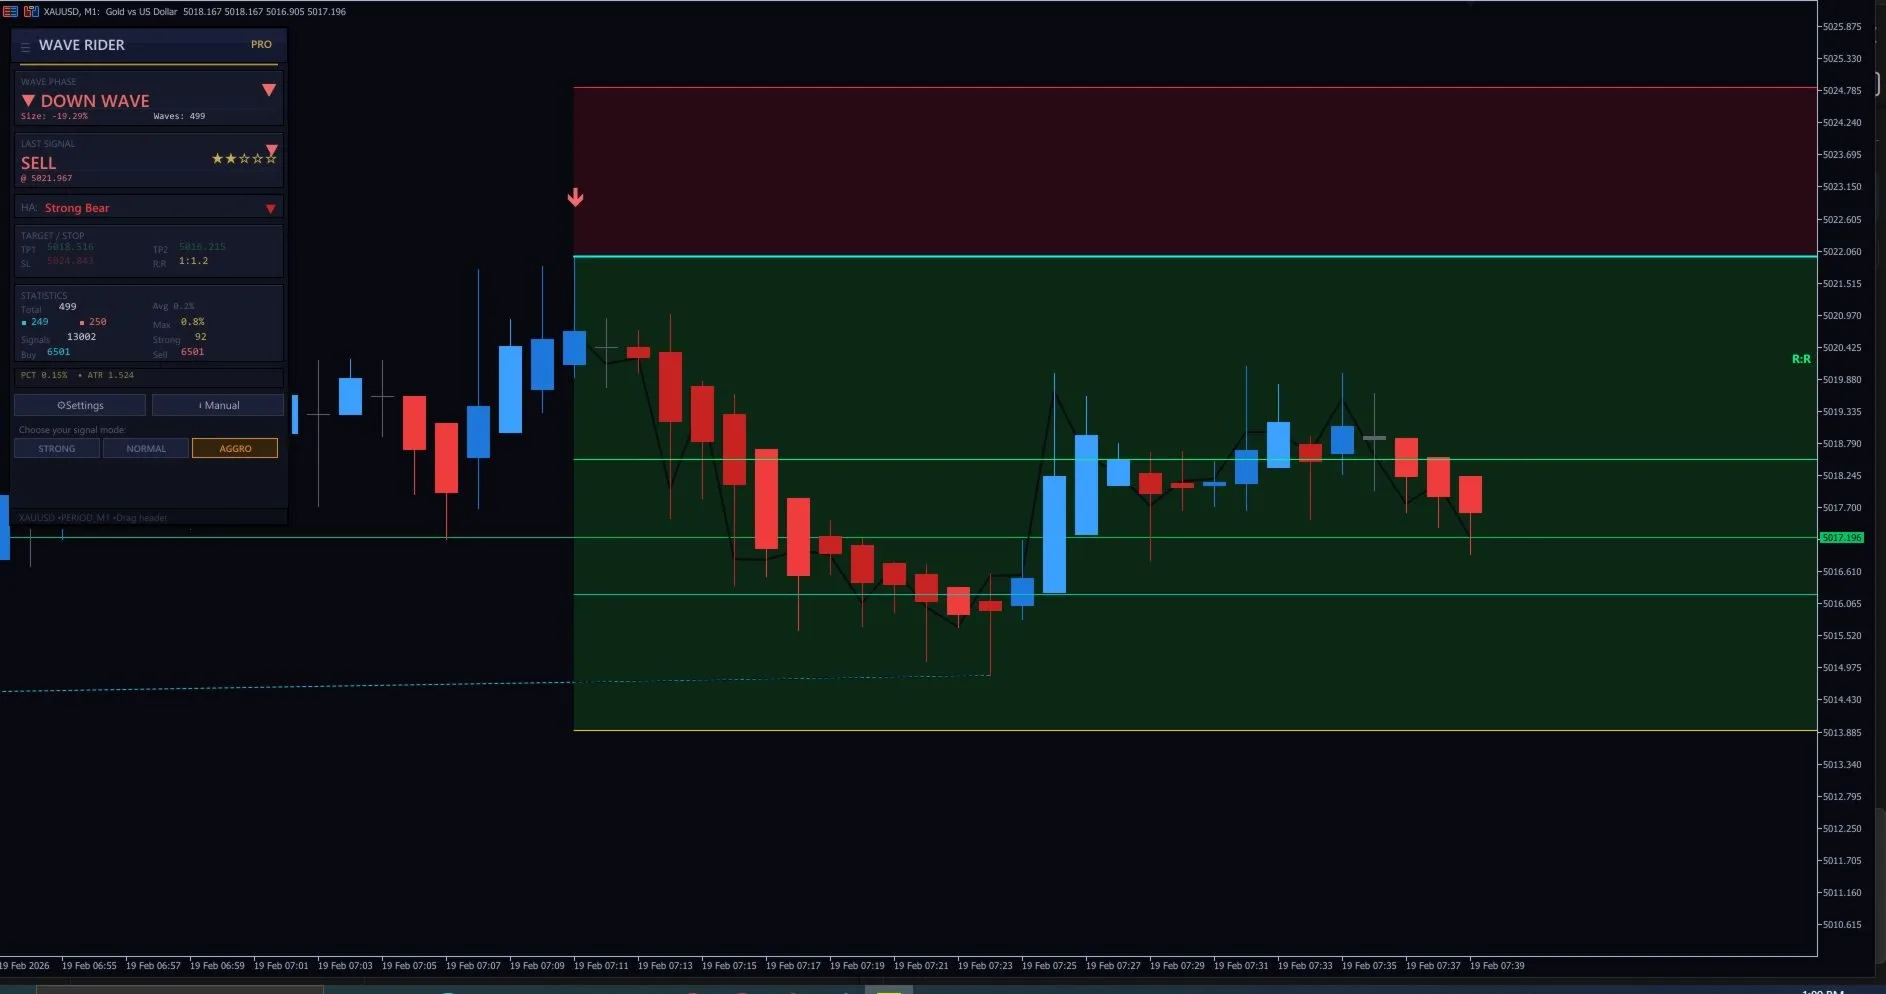
My Wave Rider Pro indicator is built specifically to identify these momentum waves across timeframes. It calculates wave strength, tracks the three-wave pattern, and signals optimal entry points during Wave 2 corrections. The key differentiator: it measures momentum objectively using candle body ratios and ribbon expansion rates, rather than relying on subjective visual assessment.
Practical Exercise: Paper Trade Waves for a Week
If this approach interests you, here's what I'd suggest before risking any real money:
- Open XAUUSD on M5 during London session (08:00-15:00 GMT).
- Put a 6-EMA ribbon on the chart.
- When you see a strong impulse move (3+ directional candles with expanding ribbon), label it "Wave 1" on the chart.
- When price pulls back into the ribbon without breaking through the slowest EMA, label it "Wave 2."
- Watch what happens next. Does price continue beyond the Wave 1 high? That's Wave 3.
- Note how far Wave 3 extends compared to Wave 1.
Do this for five trading days. Don't trade — just observe and label. By the end of the week, you'll start recognizing the three-wave pattern in real time. That recognition is the foundation of momentum wave trading.
Once you can see it consistently, start paper trading entries at Wave 2. Use a trailing stop behind the EMA ribbon. Keep records. If the approach works for your personality and schedule, then — and only then — consider live trading it with small position sizes.
Disclaimer: This article describes my personal trading approach and is educational content, not financial advice. Trading gold and other financial instruments carries significant risk. Past performance does not guarantee future results.