Every trader who learns about supply and demand zones faces the same problem: the chart is covered in rectangles, and they all look equally valid. Buy at every demand zone? Sell at every supply zone? That's a recipe for a 40% win rate and a declining equity curve. The art of zone trading isn't finding zones — it's filtering them.
The most important filter I use is zone freshness. A fresh zone — one that price has never revisited since it formed — has dramatically different statistics than a tested zone that price has bounced from two or three times already. Here's how I grade them and which ones I actually trade.
What Makes a Supply or Demand Zone?
Before discussing freshness, let's establish what qualifies as a zone in the first place:
A demand zone forms when aggressive buying creates a strong bullish candle (or series of candles) departing from a base. The base — the area of consolidation before the explosive move — becomes the demand zone. Think of it as: a price level where unfilled buy orders remain.
A supply zone is the opposite: aggressive selling creates a strong bearish move away from a base. That base is where unfilled sell orders remain.
The three patterns I look for:
- Rally-Base-Drop (RBD): Price rallies, pauses (base), then drops sharply. The base is a supply zone.
- Drop-Base-Rally (DBR): Price drops, pauses (base), then rallies sharply. The base is a demand zone.
- Rally-Base-Rally (RBR): Price rallies, pauses, then continues rallying. The base is a demand zone (continuation).
- Drop-Base-Drop (DBD): Price drops, pauses, then continues dropping. The base is a supply zone (continuation).
The key word in all of these is departure speed. If price left the zone with a massive candle (big body, small wicks), the zone is strong. If it left lazily with overlapping candles and long wicks, the zone is weak.
Fresh Zones: Why They Matter
A fresh zone is one that price has not revisited since it was created. The theory: institutional orders that created the zone were partially filled. The remaining unfilled orders still sit at that price level. When price returns to a fresh zone for the first time, those resting orders activate and push price away again.
Statistics I've observed over 3+ years of gold zone trading:
- Fresh zones (first touch): approximately 65-70% reaction rate on gold
- 1× tested zones (price touched once, now revisiting a 2nd time): approximately 50-55% reaction rate
- 2× tested zones (third visit): approximately 35-40% reaction rate
- 3+ times tested: treat it as broken — institutions have finished filling their orders
This makes sense from an order flow perspective. Each time price touches the zone, some of those resting orders get filled. By the third or fourth touch, the order pool is depleted and the zone breaks.
How I Grade Zone Quality
Freshness is the first filter, but not the only one. I use a multi-factor grading system:
Factor 1: Freshness (Most Important)
- A+: Fresh zone, never tested
- B: Tested once with a strong rejection (long wick, didn't close inside zone)
- C: Tested twice — only trade with additional confluence
- Skip: Tested 3+ times — the zone is dead
Factor 2: Departure Speed
How fast did price leave when the zone was created?
- A+: Single massive candle, 3×+ the average candle size, small wicks
- A: Two strong candles departing with minimal overlap
- B: Gradual departure (3-5 candles), still trending but no explosive move
- C: Weak departure with overlapping candles — probably not a real institutional zone
Factor 3: Time at Base
How long did price consolidate in the base before departing?
- A+: 1-3 candles of basing (tight consolidation = strong conviction)
- B: 4-7 candles (moderate consolidation)
- C: 8+ candles (extended range — too many orders already filled during the base)
Factor 4: Zone Width
- A: Narrow zone (tight base) — clear entry with small SL
- B: Moderate width — acceptable but wider SL needed
- C: Wide zone — hard to trade with good R:R because your SL must cover the entire zone width
Factor 5: Higher Timeframe Alignment
- A+: M15 demand zone sitting inside H4 demand zone = double demand alignment
- B: M15 zone with no higher TF zone nearby — still tradeable but less conviction
- Skip: M15 demand zone sitting inside H4 supply zone = conflicting timeframes
I combine these factors into a composite grade. If any factor is C, I need at least two A+ factors to take the trade. If freshness is C or Skip, I don't trade it regardless of other factors.
Zone Detection: Manual vs Automated
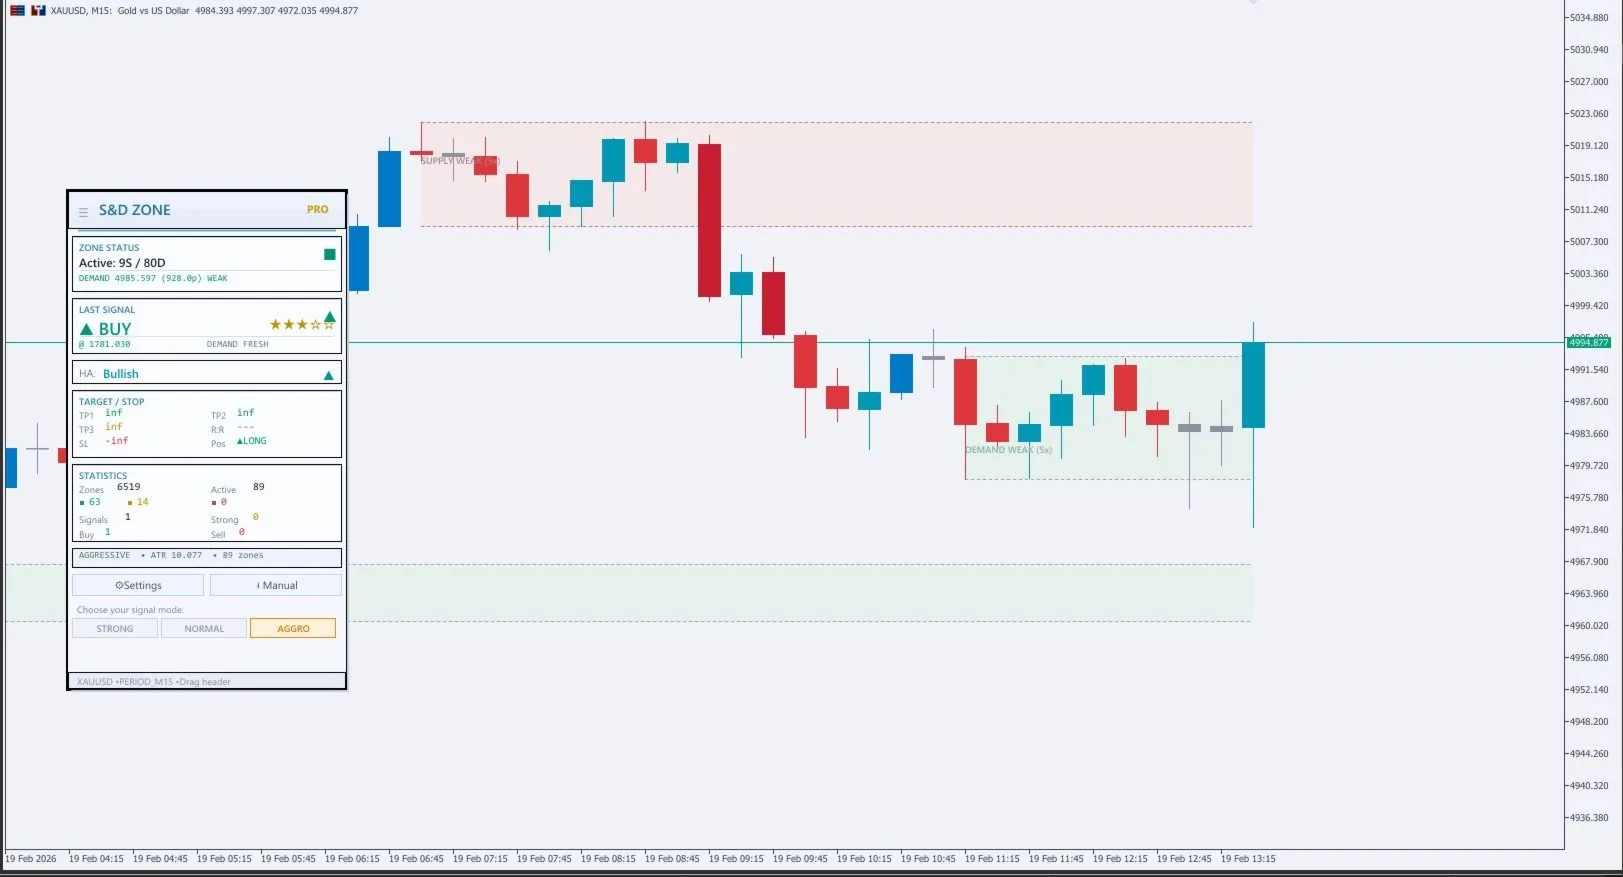
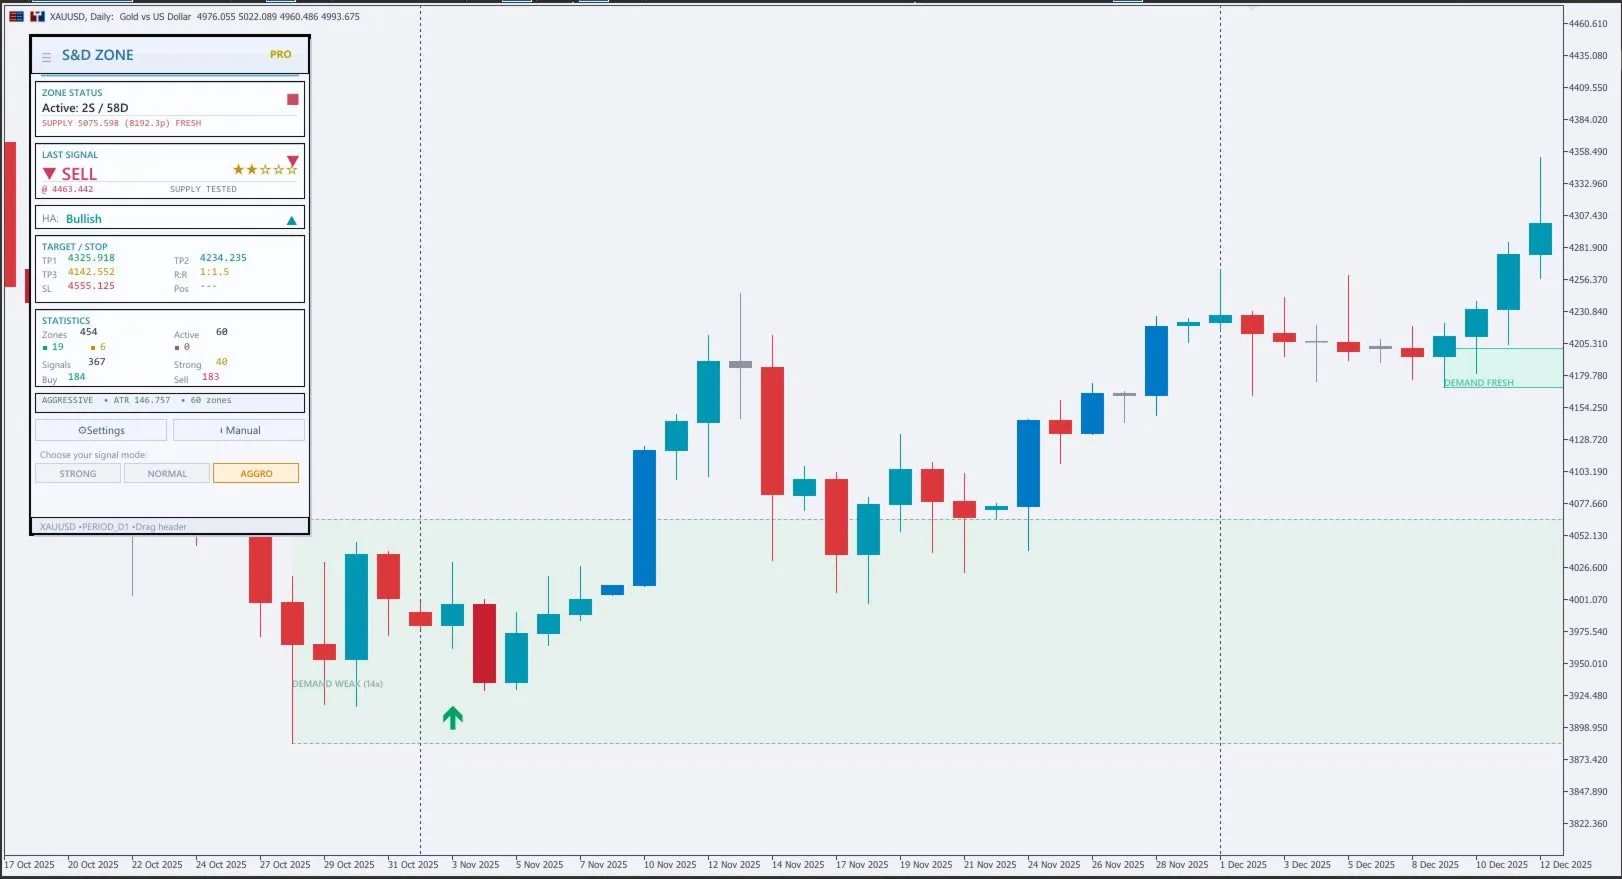
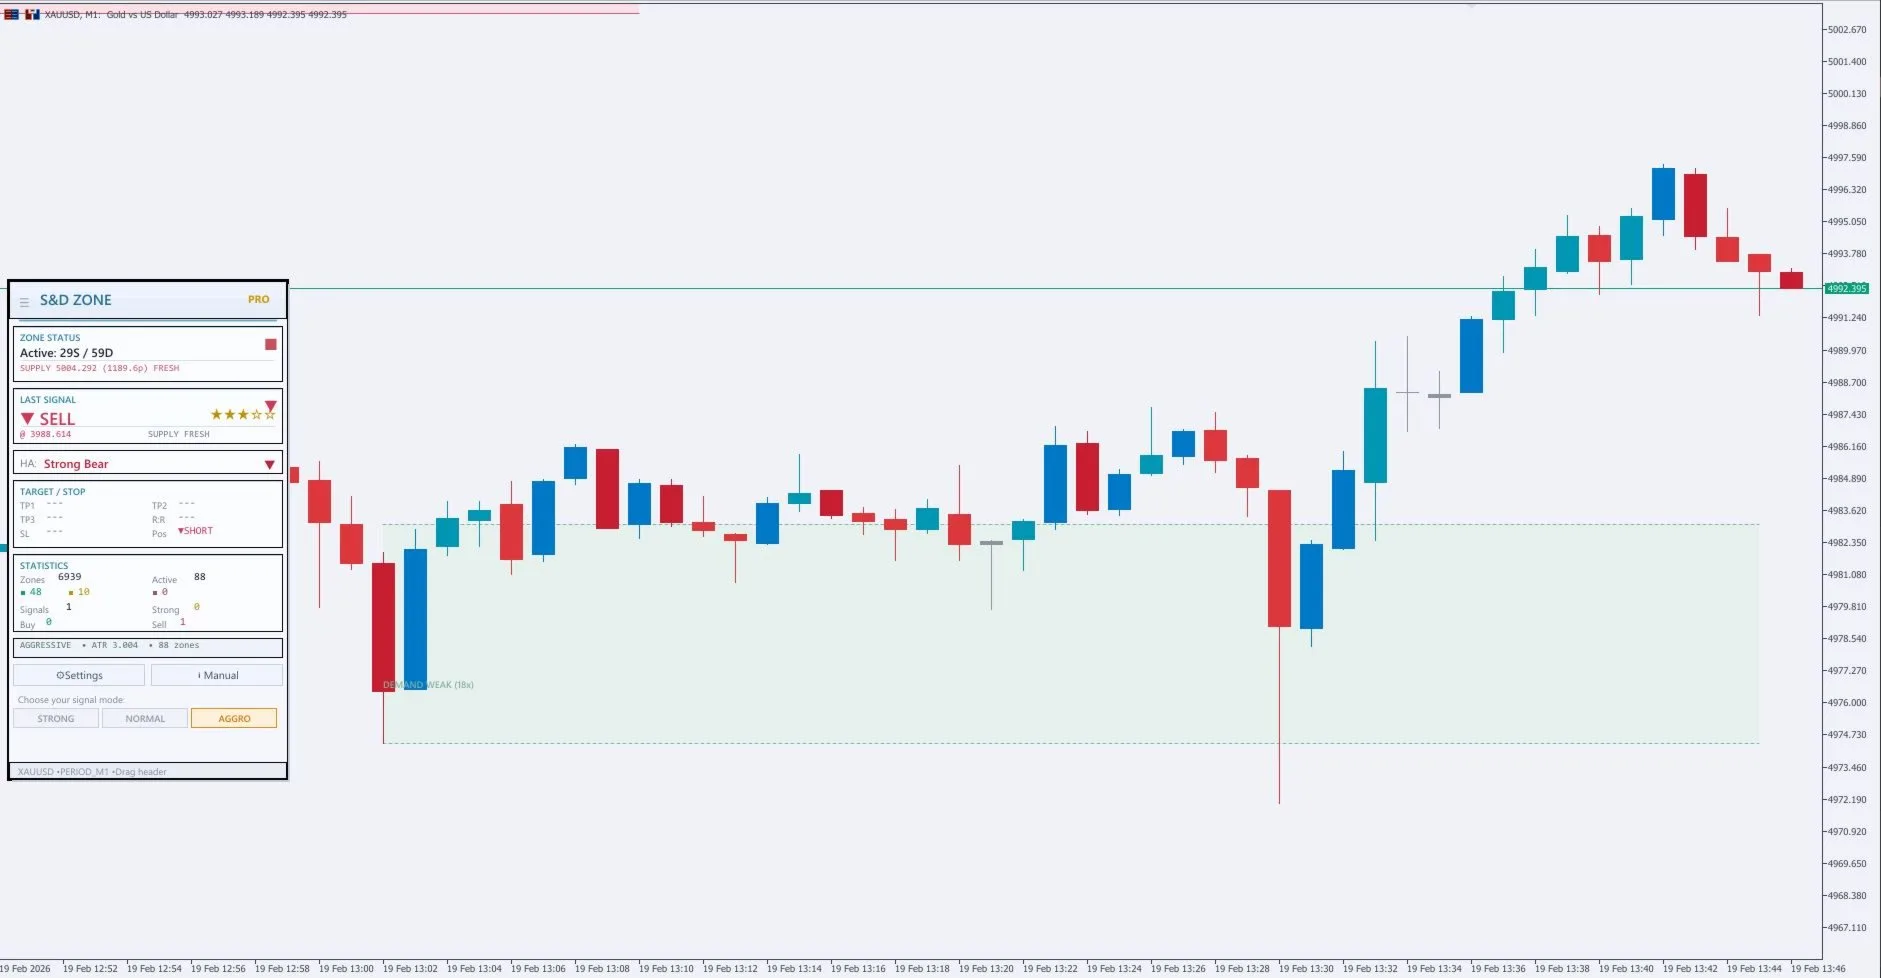
Drawing zones manually teaches you the concepts, but it's slow and subjective. Two traders can draw very different zones on the same chart. I use Supply Demand Zone Pro for automated detection because:
- It identifies zones algorithmically using departure candle body-to-wick ratio, candle size relative to ATR, and base width
- Fresh zones are displayed differently from tested zones — untested zones are solid color, tested ones are faded
- Zone strength is scored (combining departure speed, base size, and freshness count)
- Multi-timeframe overlay: see H4 zones on your M15 chart so you know when a lower-TF zone aligns with a higher-TF zone
- Zones auto-update: when a zone gets tested, its visual changes. When it gets broken (price closes through it), it's removed or marked broken
This saves 15-20 minutes of chart prep per session and eliminates the subjectivity of manual drawing.
Combining Zones with Order Block Analysis
Supply and demand zones and order blocks are related but not identical concepts. Order blocks specifically identify the last opposing candle before a directional move — it's a smart money concept. Supply/demand zones focus on the base where orders accumulated.
The highest probability trades happen when both align: a fresh demand zone that coincides with a bullish order block. When I see that overlap, I know two different analytical frameworks are pointing to the same price level.
Using both Supply Demand Zone Pro and Order Block Sniper Pro on the same chart creates a visual confluence map. When a grey demand zone rectangle overlaps with a blue order block rectangle, that's a high-conviction level.
My Zone Trading Workflow for Gold
Here's my step-by-step process for each session:
Step 1: Mark Higher TF Zones (H4 and Daily)
Before the session starts, I check H4 and Daily charts for active supply and demand zones. These are my "areas of interest" — I only take lower TF trades when price is approaching or reacting from an HTF zone.
Step 2: Drop to M15/M30 for Entry Zones
Within the HTF zone, I look for M15 or M30 supply/demand zones that provide precision entries. Fresh M15 demand inside H4 demand = ideal long entry area.
Step 3: Wait for Price to Enter the Zone
This is the hardest part. I don't chase. I set alerts at the top edge of demand zones and the bottom edge of supply zones. When the alert triggers, I switch to a lower TF (M5 or M1) for entry timing.
Step 4: Entry Confirmation
I don't blindly buy at every demand zone. I need confirmation:
- A rejection candle (pin bar or engulfing) at the zone edge
- The EMA ribbon starting to flatten or curl on M5
- A strong signal confluence score from my indicator stack
Step 5: SL Placement
Stop loss goes below the demand zone (for longs) or above the supply zone (for shorts) — not at the zone edge, but past it. On gold, I add a 50-100 point buffer beyond the zone because institutional sweeps often wick through the zone edge before reversing.
Step 6: TP and Management
First TP target: the nearest opposing zone. If I'm long from a demand zone, TP1 is the nearest supply zone above. I use Smart Trade Manager Pro for partial closes at each level and trailing stop on the runner.
Which Timeframe Zones Are Most Reliable?
Reliability increases with timeframe:
- Daily/Weekly zones: Very high reliability. These are institutional accumulation/distribution areas. When price reaches a Daily fresh demand zone, expect a significant reaction.
- H4 zones: The sweet spot for swing trading gold. H4 zones provide excellent risk-reward with clear zone boundaries.
- H1 zones: Good for intraday trading. H1 zone + HTF alignment = strong setup.
- M15/M30 zones: Best for precision entries within higher TF zones. Don't trade M15 zones in isolation — always check if they align with H4+ zones.
- M5 zones: Too noisy on their own. Only use for entry timing after confirming from M15+ analysis.
When Zones Break: What It Tells You
A zone "breaks" when price closes through it (not just wicks through). When a demand zone breaks:
- The buy orders that were resting there have been absorbed — bears overwhelmed the buyers
- The former demand zone often becomes a supply zone on the flip (role reversal)
- If price was inside a higher TF demand zone and a lower TF demand zone broke, it doesn't necessarily mean the HTF zone is broken. Watch for price to create a new demand zone within the HTF zone
One of the most powerful setups is the zone flip retest: demand breaks, price rallies back to it (now acting as supply), and sellers reject it. This pattern has a high success rate because it represents a genuine shift in market structure — confirmed by the break, and validated by the rejection.
Supply and Demand Zones for Gold Session Trading
Gold zone trading combines especially well with session-based analysis:
- Asian session often creates tight demand/supply zones (the Asian range is a base). These become the zones that London breaks out of or tests.
- London open often tests the nearest fresh zone — either the Asian high (supply) or Asian low (demand). When London breaks through the Asian range and returns to test it, that's a zone flip in action.
- NY session often reaches for the next HTF zone that London didn't get to. If London tested the daily demand zone and rallied, NY often reaches for the daily supply zone above.
Using Gold Session Sniper Pro alongside Supply Demand Zone Pro gives you session context overlaid on zone analysis — seeing that price is approaching a fresh H4 demand zone right at the start of London is a high-conviction signal.
Common Zone Trading Mistakes
- Trading every zone: Just because a zone exists doesn't mean it's tradeable. Apply the grading system above. Trade A+ and A zones only.
- Drawing zones too wide: Your SL needs to cover the entire zone plus a buffer. A 500-point wide zone on M15 with a 50-point buffer means a 550-point SL. On gold, that's significant risk requiring very small position sizing.
- Ignoring HTF context: An M15 demand zone means nothing if price is inside a daily supply zone and trending down. Always check the bigger picture first.
- Not adapting to news events: Major news releases (FOMC, NFP, CPI) can blow through any zone regardless of quality. Tighten your zone trading during high-impact news windows or stay flat.
- Treating zones as exact prices: Zones are areas, not lines. Don't place limit orders at the exact zone edge — use the zone as an area of interest and look for confirmation within or near it.
Zone trading is conceptually simple — buy at demand, sell at supply. The edge comes from filtering zones by freshness, grading them by quality, aligning with higher timeframes, and having the patience to wait for price to come to you instead of chasing. Master this approach, and you'll always know where the high-probability levels are on your gold chart.
Zone Grading System: How I Rate Supply and Demand Zones
I assign each zone a letter grade from A to D before trading it. Here's my grading criteria:
- A-Grade Zone (take full size, aggressive entry): Fresh (never tested), formed by a strong impulse move (3+ consecutive bullish/bearish candles), aligns with H4 trend direction, sits at or near a round number, departure candle has above-average volume. These appear 2-3 times per week on XAUUSD.
- B-Grade Zone (take full size, wait for confirmation): Fresh zone, decent impulse, aligns with H1 trend. May lack one quality factor (e.g., average volume, not near a round number). I trade these with a confirmation candle rather than limit order entry.
- C-Grade Zone (half size or skip): Tested once but held. Moderate impulse. Trend alignment on lower timeframes only. These are tradeable in strongly trending markets but skippable during range-bound conditions.
- D-Grade Zone (skip completely): Tested multiple times, weak impulse, counter-trend, formed during low-liquidity sessions. No matter how "clean" it looks on the chart, the probability is too low.
The Supply Demand Zone Pro indicator marks zones automatically, but the grading is my manual layer on top. I quickly assess each marked zone against the criteria above and only put pending orders at A-grade and B-grade levels.
Multi-Timeframe Zone Analysis: The Top-Down Approach
Zone trading becomes exponentially more powerful when you analyze across multiple timeframes. Here's my exact workflow:
- Weekly chart (W1): Identify the major supply and demand zones that have held for months. These are the "fortress" levels where price makes significant reversals. On gold, the weekly demand zone from the 2024 consolidation around $2,300-2,350 was a major buy zone that produced $200+ rallies each time it was tested.
- Daily chart (D1): Mark the active daily zones within the context of weekly levels. Daily zones that align with weekly zones are the highest probability setups available. A fresh daily demand zone sitting inside a weekly demand zone is an A+ setup by default.
- 4-Hour chart (H4): This is my primary trading timeframe for zone identification. H4 zones give specific price levels for entries, while daily/weekly provide directional bias. I want to buy at H4 demand zones when D1 and W1 are both bullish.
- 1-Hour chart (H1): Fine-tune entries. When price reaches an H4 demand zone, I drop to H1 to look for the first bullish reaction candle as my entry trigger. This improves fill quality and reduces the stop loss needed.
The power of this approach is layered confluence. A random M15 demand zone is a 45-50% probability trade. An M15 demand zone inside an H4 demand zone inside a D1 demand zone is a 65-70% probability trade — and the R:R improves because the higher-timeframe zone provides a natural, wide take-profit target.
Frequently Asked Questions
What is the difference between supply/demand zones and support/resistance?
Support and resistance are typically drawn as single lines at price levels where reversals occurred. Supply and demand zones are price AREAS (ranges) representing institutional buying or selling activity. A support level might be at $2,650, while a demand zone would be $2,640-$2,660. Zones are more practical because institutional orders aren't placed at a single price — they're distributed across a range. Trading zones rather than lines gives you more room for entries and more realistic stop loss placement.
How do I know if a supply/demand zone is still valid?
A zone remains valid as long as it's "fresh" (price hasn't returned to it since formation) or has been tested only once and held with a strong rejection. Once price enters a zone and trades through it without reversing (breaks through the opposite side), the zone is invalidated. The Supply Demand Zone Pro indicator automatically removes broken zones and highlights fresh ones, saving you from manually tracking zone status.
Should I use limit orders or market orders at supply/demand zones?
For A-grade fresh zones with strong trend alignment, limit orders work well — set a buy limit at the top of a demand zone or a sell limit at the bottom of a supply zone. For B-grade and C-grade zones, use market orders with confirmation: wait for price to enter the zone and show a rejection candle (engulfing, pin bar, doji) before entering. Limit orders are more capital-efficient but risk getting filled on a fake-out. Confirmation entries miss some pips but avoid more false entries.
How many times can a supply/demand zone be tested before it breaks?
In my experience with gold, most zones break on the 2nd or 3rd test. Fresh zones (first test) have the highest reaction probability (~65%). Once-tested zones that held have approximately 50% probability on the second visit. After 3 touches, I consider the zone depleted — the institutional orders that created it have been filled. This is the core "fresh vs tested" framework: each test weakens the zone until it eventually gives way.
Can supply and demand zones predict reversals?
Zones don't predict — they identify areas where reversals are more PROBABLE. A fresh demand zone from a strong rally means institutions bought heavily there. When price returns, there may be remaining buy interest that triggers another rally. But "may" is the key word. This is why every zone trade needs a stop loss below the zone boundary. Zone trading is a probability framework, not a prediction system. With proper filtering (freshness, impulse strength, trend alignment), you put probability on your side across hundreds of trades.
What indicators work best with supply and demand zone trading?
EMA ribbons for trend direction (trade demand zones in uptrends, supply zones in downtrends), RSI for momentum confirmation (don't buy demand in oversold momentum that hasn't turned), and volume for zone validation (high volume at zone formation = stronger institutional activity). The combination I use daily is the Supply Demand Zone Pro for zone identification, Gold EMA Ribbon Scalper Pro for trend context, and confluence scoring to grade the overall setup quality before entering.
Disclaimer: This article presents a personal trading approach using supply and demand zone concepts. It is not financial advice. Trading XAUUSD carries substantial risk. Past zone reactions do not guarantee future results. Always use proper risk management including stop losses and position sizing appropriate for your account.