Smart Money Concepts — or SMC — has become the most hyped trading methodology of the past few years. YouTube is flooded with videos about order blocks, fair value gaps, breakers, mitigation blocks, propulsion blocks, and about fifteen other terms that seem designed to confuse you.
Here's my honest take: the core ideas behind SMC are genuinely useful. But the community around it has wrapped simple concepts in so much unnecessary jargon that most traders end up more confused after studying SMC than before.
I'm going to cut through all that nonsense. In this article, I'll explain the three SMC concepts that actually matter for practical trading, what they look like on a real chart, and how I use them in my own gold scalping. No Instagram-style chart markup. No secret "inner circle" terminology. Just clear explanations.
What "Smart Money" Actually Means
Before we get into the concepts, let's clarify what "smart money" refers to. It's not some shadowy cabal of bankers controlling the market from a boardroom. It's simpler than that.
Smart money = institutional traders. Banks, hedge funds, central bank operations, large commodity funds. These entities trade such massive positions that they can't just click "buy" and get filled at one price like you and I can. They need to accumulate positions over time, and they need liquidity to absorb their orders.
That need for liquidity creates predictable patterns in price. SMC is essentially a framework for identifying where institutions are likely to have placed orders, where they need price to go to fill those orders, and where their positions are being managed.
It's supply and demand economics applied to short-term price action. That's all it is.
Concept 1: Order Blocks (Where Institutions Loaded Up)
The simple version:
An order block is the last candle of one direction before a strong move in the opposite direction. It marks the zone where institutions likely accumulated their position before pushing price away.
What it looks like:
Price is moving down. Then you see one final bearish candle (or a cluster of candles), followed by a sudden, strong bullish move that breaks above recent structure. That final bearish candle before the reversal is a bullish order block.
The idea is that institutions were buying during that final bearish candle — absorbing all the retail selling pressure — and once they had enough, they let price fly upward.
Why it matters:
When price comes back to an order block zone in the future, there are often unfilled institutional orders still sitting there. So the zone acts as a strong support (for bullish OBs) or resistance (for bearish OBs). Price tends to react at these zones — bouncing, consolidating, or reversing.
How I actually use order blocks:
I don't treat them as guaranteed bounce zones. I use them as areas of interest — places where I pay extra attention to my other signals. If my multi-timeframe analysis points bullish and price pulls back into a bullish order block, that's a high-probability zone for entry. The confluence of MTF alignment plus OB support gives me more confidence.
But an order block alone, without any other confirmation? I'm not trading it. Context matters more than any single concept.
What most people get wrong:
Not every candle before a reversal is a valid order block. The move away from the block needs to be impulsive — a strong, dominant candle or sequence that breaks structure. If price just gently drifts away, it's not an order block. It's just a random candle.
Concept 2: Fair Value Gaps (Where Price Moved Too Fast)
The simple version:
A fair value gap (FVG) is a three-candle pattern where the middle candle moves so aggressively that there's a gap between the first candle's high/low and the third candle's low/high. In other words, the middle candle's body is so big that the wicks of the surrounding candles don't overlap.
What it looks like:
Three candles in a row. Candle 1 closes at, say, 2040. Candle 2 is a massive bullish candle that opens at 2040 and closes at 2055. Candle 3 opens at 2053. The gap between Candle 1's high (around 2041) and Candle 3's low (2053) is the fair value gap. Price "skipped over" the 2041-2053 zone without properly trading through it.
Why it matters:
Markets tend to be efficient over time. When price moves too fast through a zone, it often comes back to "fill" that gap — to let orders get executed in that price range. Think of it as the market returning to pick up passengers it left behind.
This doesn't always happen immediately. Sometimes FVGs get filled within an hour. Sometimes price comes back days later. And sometimes — in very strong trends — FVGs don't get filled at all, which actually tells you how strong the trend is.
How I actually use FVGs:
I use them as potential pullback targets. If I'm looking for a long entry and there's an unfilled bullish FVG below the current price, I'll set my entry order at the top of that gap. Price often pulls back exactly to the FVG boundary before continuing the trend.
I also use unfilled FVGs as a trend strength indicator. If a move creates multiple FVGs and none of them get filled, that's an incredibly strong trend. I stay in my position longer or look for continuation entries rather than expecting a reversal.
Concept 3: Liquidity Sweeps (Where Stops Get Hunted)
The simple version:
Liquidity sweeps happen when price briefly breaks above a resistance level (or below support) to trigger stop-loss orders sitting there, then immediately reverses. The "stop hunt" you've probably experienced.
What it looks like:
Price has bounced off a resistance level twice. Retail traders see "double top" and place their stop losses just above that level. Then price pushes above the double top — triggering all those stops — and immediately reverses downward.
The institutions needed those stop-loss orders to execute as buy orders (since a sell stop triggers a buy). Those buy orders provide the liquidity institutions need to fill their own sell positions. Once they're filled, they let price drop.
Why it matters:
If you understand where retail traders place their stops (spoiler: at obvious levels like double tops, double bottoms, and round numbers), you can anticipate where liquidity sweeps might happen. Instead of getting stopped out, you can wait for the sweep to complete and then enter in the real direction.
How I actually use liquidity sweeps:
This is directly relevant to my London session trading. That "stop hunt" I described during the London open (08:30-09:00 GMT)? That's a classic liquidity sweep. Price breaks above or below the Asian session range to grab stops, then reverses.
I wait for the sweep to happen, then look for my ribbon-based entry in the opposite direction. The sweep itself is confirmation that the real move is coming.
What I Ignore in SMC
Not everything in the SMC playbook is worth your attention. Here's what I've found to be unnecessary complexity:
Breaker blocks, mitigation blocks, propulsion blocks: These are variations of order blocks with extra conditions. In my experience, the distinction doesn't add enough value to justify the extra analysis time. A strong order block is a strong order block regardless of what subcategory it falls into.
Wyckoff schematics: Some SMC teachers overlay complex Wyckoff accumulation/distribution schematics on every chart. While Wyckoff theory is legitimate, trying to identify specific scheme phases in real-time is subjective and error-prone. I prefer simpler structural analysis.
Institutional candle analysis: The idea that you can determine institutional intent from individual candle shapes on a 5-minute chart is, in my opinion, reaching. Candle shapes on low timeframes are largely noise.
Combining SMC with Technical Indicators
Here's a controversial opinion in the SMC community: I use indicators alongside SMC concepts. Many SMC purists will tell you indicators are useless because they lag. They're wrong — or at least, they're oversimplifying.
Indicators like EMA ribbons, supply/demand zone detectors, and momentum oscillators provide objective confirmation of what you're seeing in price structure. An order block zone that also aligns with an EMA ribbon pullback area is stronger than either signal alone.
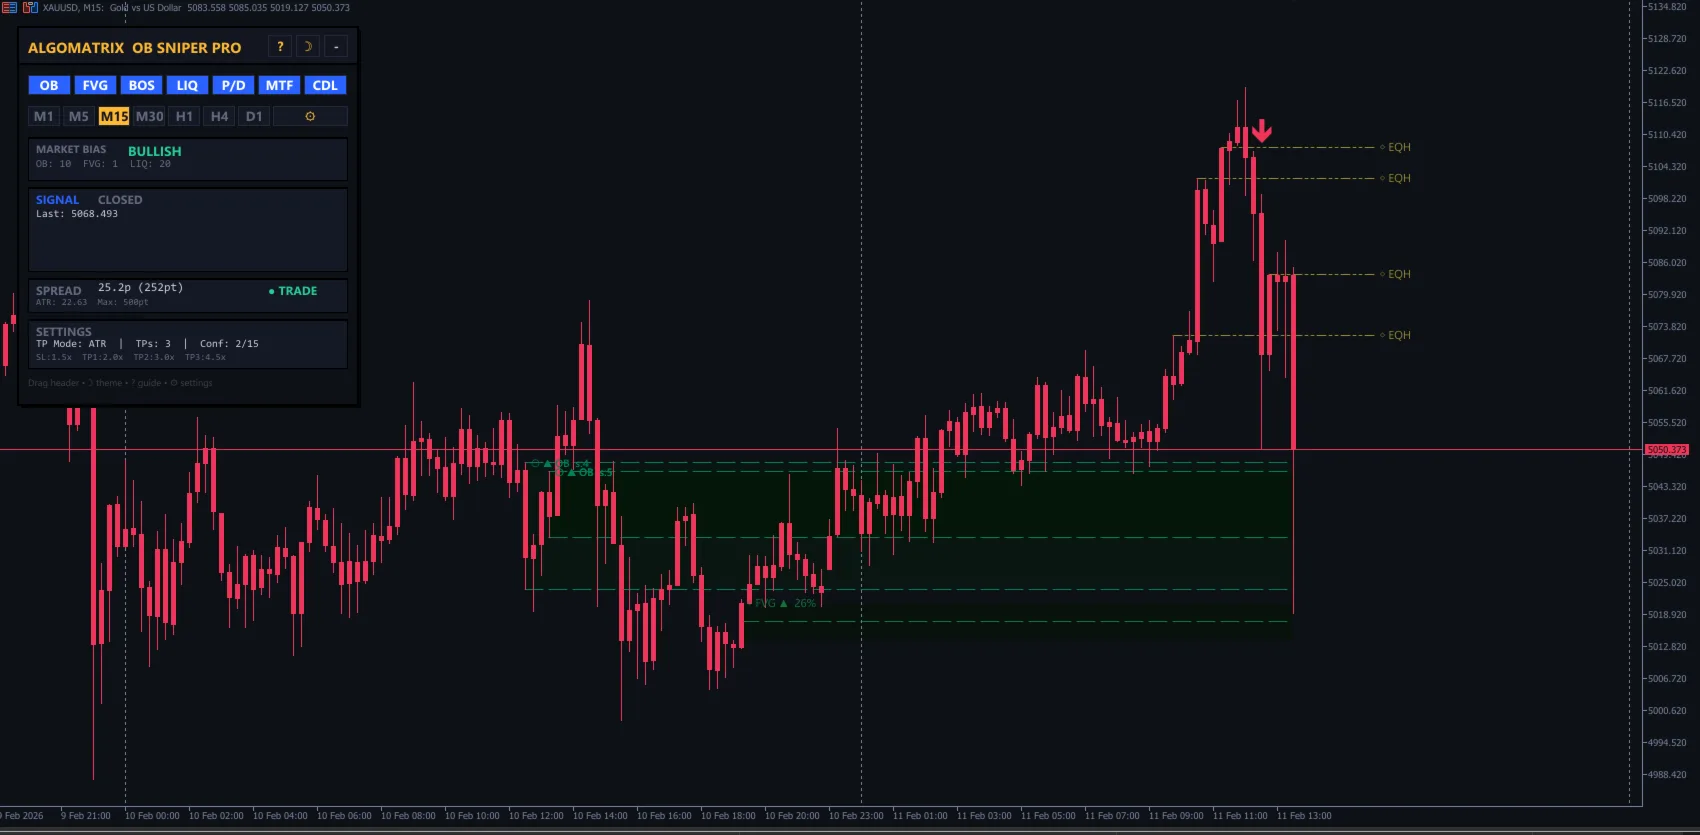
This is exactly why I built Order Block Sniper Pro — it automatically detects and draws valid order blocks on your MT5 chart based on algorithmic criteria: impulsive move away, proper structure break, and volume confirmation. No subjective judgment needed.
Similarly, my Supply & Demand Zone Pro identifies high-probability supply and demand zones where institutional activity is likely present. These zones overlap significantly with SMC concepts but are calculated algorithmically rather than drawn by eye.
The Practical Framework I Use
Here's how I integrate SMC concepts into my actual trading without overcomplicating things:
- Identify the trend using multi-timeframe EMA ribbon analysis (H4 → H1).
- Mark key levels — recent order blocks, unfilled FVGs, and obvious liquidity pools (equal highs/lows, round numbers).
- Wait for price to reach a key level that aligns with the trend direction.
- Look for confirmation — ribbon pullback rejection, candlestick pattern at the level, or a liquidity sweep followed by reversal.
- Enter with defined risk — stop behind the order block or beyond the liquidity sweep.
That's it. Five steps. No need to identify seven different block types, label every candle with Wyckoff terminology, or draw 30 lines on your chart.
A Word of Caution
SMC is not a magic framework. It doesn't give you an edge just because you learned the vocabulary. I've seen traders who can identify every order block and FVG on a chart but still lose money consistently because they lack discipline, risk management, and patience.
The concepts are tools. Like any tool, they work when used properly and in the right context. An order block on a 1-minute chart during Asian session is not the same as an order block on the H1 during London session. Context — session, timeframe, trend, volatility — is what separates profitable application from theoretical knowledge.
Learn the three core concepts I described above. Practice identifying them on historical charts. Then paper-trade with them for at least a few weeks before risking real money. That's the honest path to using SMC effectively.
Disclaimer: This article represents my personal understanding and application of Smart Money Concepts. SMC is interpretive by nature and different traders may apply these concepts differently. Trading involves significant risk. This is educational content, not financial advice.