Everyone draws supply and demand zones. Most people draw them wrong. And the difference between zones that hold and zones that get blown through isn't about technique — it's about understanding why certain price levels matter to the traders who actually move the market.
I spent almost a year thinking I understood supply and demand trading before realizing I was drawing textbook rectangles that had nothing to do with where real orders were sitting. The zones I was marking looked clean on the chart but got destroyed during live trading about 60-70% of the time. That's worse than random.
What changed my S&D trading wasn't learning a new "method." It was understanding what creates a genuine supply or demand zone versus what just looks like one. Let me share the shift.
Why Most Supply and Demand Zones Fail
Open any trading education channel and you'll see the same process: find a big candle, draw a rectangle around the base, wait for price to return. It seems logical. A big move started from that level, so there must be unfilled orders there, right?
Sometimes yes. Usually no. Here's why most of these zones fail.
The "Big Candle" Trap
A large bullish candle might start from 2640, so you mark 2638-2642 as a demand zone. But that big candle might have been caused by a news spike, stop-hunt, or algorithmic momentum cascade — not by genuine institutional buying that left unfilled orders behind.
The difference matters enormously. If institutional orders caused the move, there may be remaining orders at that level waiting to be filled. If it was a news spike or cascade, there's nothing left — the move was a one-time event.
I learned to ask: "What caused this move?" before marking any zone. If I can't identify a plausible reason for institutional order flow at that level, I don't mark it.
Zones That Have Already Been "Filled"
This is the error I see most often. Traders mark a demand zone, price returns to it and bounces, then they keep that zone on the chart expecting it to hold again.
The logic of S&D zones is that unfilled orders sit at a level. When price returns and those orders get filled, the zone has served its purpose. It might hold a second time if new orders accumulated at the same level — but you can't assume that. The original thesis is gone.
I treat S&D zones as single-use by default. The first test is the most reliable. Second tests are possible but require additional confirmation. Three or more tests? That's not a supply/demand zone anymore — it's just a horizontal level.
Time Dilution
A demand zone from three months ago that hasn't been tested is unlikely to hold. Institutional positions have holding periods. If an institution placed orders at a level three months ago and price never returned, they've probably adjusted their position by now through other means.
I focus on zones from the last 5-15 trading days for scalping, and up to 30-40 days for swing trades. Anything older gets removed from my chart unless it's a major structural level that's been respected multiple times across months.
What Makes a Supply or Demand Zone Genuine
After filtering out the noise, here's what I look for in a zone I'll actually trade:
1. Clean Departure — The "Conviction" Test
A genuine demand zone doesn't just produce a bounce — it produces a confident, directional departure. Look at how price left the zone. Did it spring upward with strong-bodied candles, minimal upper wicks, and increasing momentum? Or did it creep away slowly with hesitation?
Strong departure = institutional conviction. The speed of the exit tells you how much capital was behind it.
On gold specifically, I want to see the departure candle's body covering at least 70% of the total candle range. Thin bodies with long wicks suggest uncertainty, not conviction. The move away from the zone should cover at least 200+ pips on M15 or 100+ pips on M5 for gold.
2. Unmitigated — First Test Matters Most
The zone hasn't been tested yet since its formation. This is non-negotiable for my highest-confidence trades. An untested zone has the highest probability of holding because whatever orders created it are still there.
When price finally returns to an unmitigated zone, I'm watching the reaction closely. A quick rejection (wicks into the zone followed by strong candle body outside) is the confirmation I need.
3. Preceded by Liquidity
The best demand zones form after a sweep of previous lows. The best supply zones form after a sweep of previous highs. Here's the logic:
When price takes out a previous swing low, it triggers stop losses from traders who were long — putting sell orders into the market. Institutions who want to buy use this selling pressure to fill their buy orders at better prices. The zone that forms after this sweep is backed by genuine institutional fill.
This is where smart money concepts overlap with S&D trading. A demand zone that forms directly after a liquidity sweep of equal lows has a completely different quality than a random zone with no context.
4. Aligns with Higher Timeframe Structure
A demand zone on M5 that sits within a demand zone on H1 is exponentially more reliable than an M5 zone in the middle of nowhere. I always check at least one timeframe above before trading any zone.
My process for multi-timeframe analysis starts on H4 to identify the overall direction, then H1 for key zones, then M15/M5 for precise entry zones within the higher-timeframe context.
My Zone Marking Process — Step by Step
Here's exactly how I identify and mark supply/demand zones on XAUUSD. This isn't a textbook method — it's what I've refined through trial and error over hundreds of trades.
Step 1: Identify the Impulse Move
Look for a strong, directional move that covers significant distance. On M5 gold, this means a move of 200+ pips (2.00+ in gold terms) within 3-8 candles. This impulse tells you that meaningful capital was deployed.
Step 2: Find the Origin
Go to the base of the impulse. The zone is not the large impulse candle itself — it's the consolidation or basing structure immediately before the impulse began. Usually this is 1-3 candles of small range that preceded the explosive move.
For demand: mark from the low of the lowest candle in the base to the open of the first impulse candle.
For supply: mark from the high of the highest candle in the base to the open of the first impulse candle.
Step 3: Apply Context Filters
Before trading this zone, check:
- Was there a liquidity sweep before the zone formed? (Increases probability)
- Does the zone align with a higher-timeframe level? (Increases probability)
- Is the zone near a round number? ($2650, $2700, $2750) — gold respects round numbers because institutional orders cluster there.
- What's the current session? Zones that formed during London/NY carry more weight than zones from the Asian session on gold.
Step 4: Wait for the Test
This is where patience matters. Don't anticipate — let price come to your zone. When it arrives, look for:
- Wick rejection into the zone with candle body closing outside the zone.
- Volume spike on the test candle (large players stepping in).
- EMA ribbon reaction — if you're using an EMA ribbon setup, look for the ribbon providing dynamic support/resistance near the zone.
Step 5: Execute with Risk Defined
Stop loss goes below the demand zone (or above the supply zone) by a small buffer — I use 30-50 pips (0.30-0.50) on gold beyond the zone edge. The zone is my thesis; if price closes through the zone, my thesis is wrong and I exit.
Target: the next opposing zone, or a 1:2 risk-reward minimum. I usually set partial TP at 1:1 and let the remainder run to the next structural level.
Fresh Zones vs Tested Zones — The Quality Scale
I mentally rank zones on a quality scale:
Grade A (high confidence): Unmitigated zone, formed after liquidity sweep, aligned with HTF structure, recent (within 5-10 sessions). These get full position size.
Grade B (moderate confidence): Unmitigated zone but missing one of the above criteria — maybe no liquidity sweep preceding it, or it doesn't align perfectly with HTF. These get half position size.
Grade C (low confidence): Zone that's been tested once already, or zone that's more than 20 sessions old on a scalping timeframe. I might trade these with small size if everything else lines up, but often I just pass.
Not tradeable: Zones tested twice or more. Zones from months ago. Zones that formed during news spikes without clear basing structure. Zones where the departure was weak or hesitant.
Common Gold-Specific Zone Behaviors
Gold (XAUUSD) has personality quirks that affect S&D zone trading differently from forex pairs:
Session Open Zones
The first 30 minutes of London open often creates a zone that gets tested during the US session. Pay attention to the range established between 08:00-08:30 London time — the high and low of this window frequently act as supply/demand zones for the remainder of the day.
Round Number Magnetism
Gold is attracted to round numbers ($2650, $2700, $2750) like a magnet. Zones near round numbers tend to be deeper (price pushes through the zone toward the round number before reversing) but also stronger. I extend my zone width by 50-80 pips when it's near a round number.
The Asian Session False Base
During the Asian session, gold often trades in a tight range that looks like a beautiful demand or supply zone. But this range is typically just low-volume compression — there's no institutional conviction behind it. London open regularly destroys these zones.
I've learned to ignore most zones that form during the Asian session unless they align with a significant HTF level. Asian session zones are where I lost the most money before understanding this pattern.
News-Created Zones — Handle Carefully
A sharp move during CPI or FOMC might create what looks like a perfect zone. But news-driven moves are often driven by short-term speculative flow, not institutional positioning. These zones can work — but they need additional confirmation if price returns to them, and they expire quickly (I give them 3-5 sessions maximum).
Automating Zone Identification
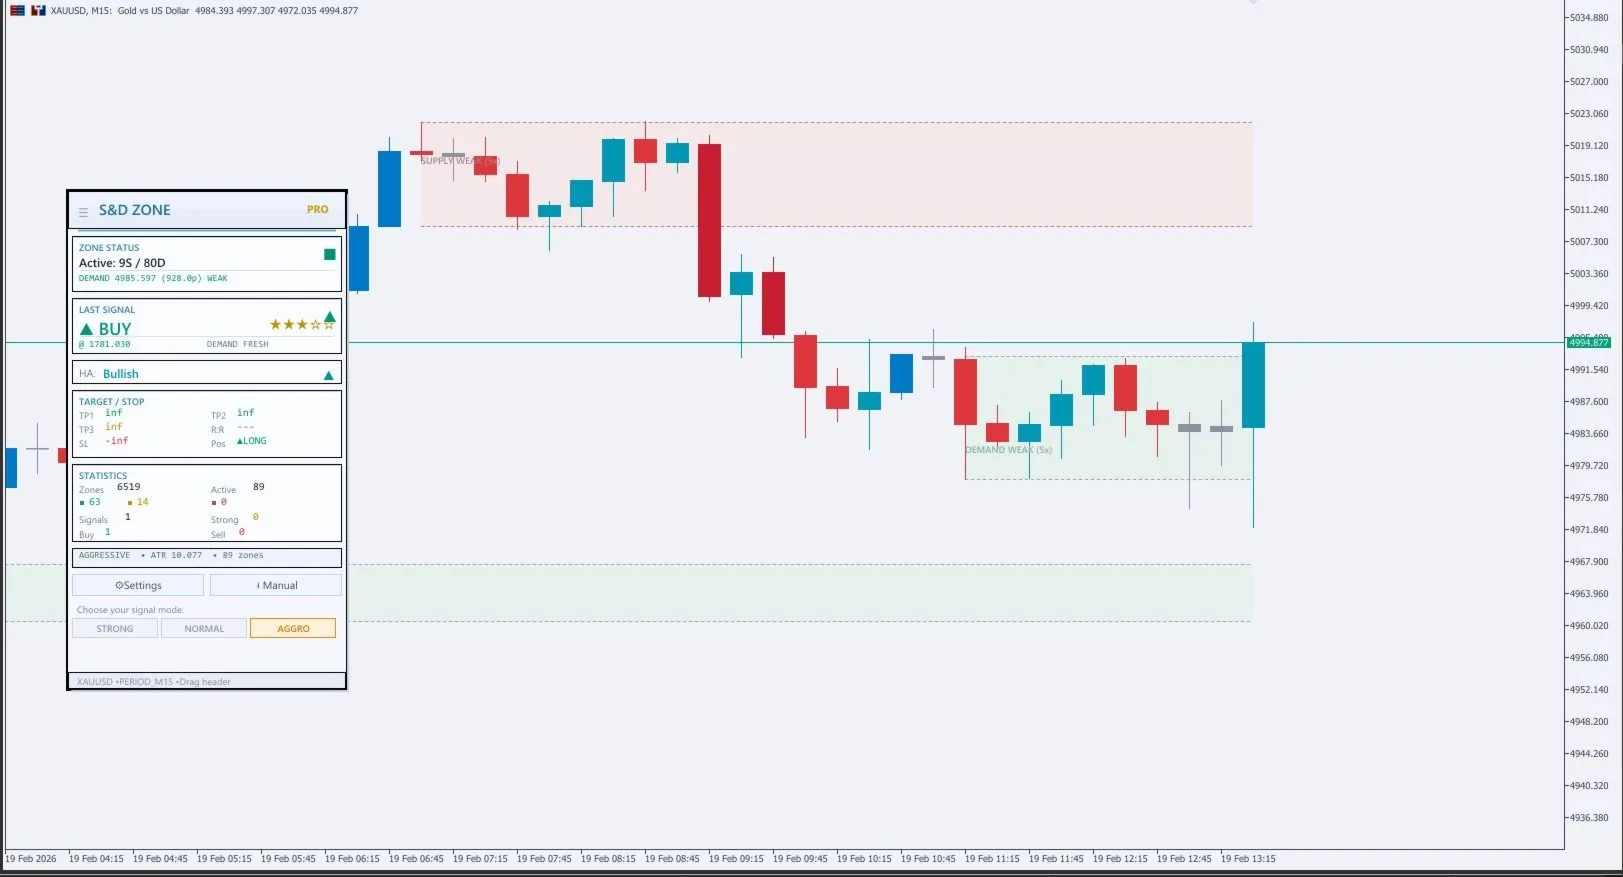
Drawing zones manually is educational but time-consuming. After doing it manually for over a year, I built an indicator to automate the process based on my criteria — that became Supply & Demand Zone Pro.
The indicator identifies zones programmatically using the same logic I use manually: strong departure, clean basing structure, unmitigated status tracking, and automatic zone removal once a zone has been tested. It classifies zones as fresh (untested) or tested, using different colors so you can immediately see which zones have highest probability.
But here's what I tell everyone: learn to draw zones manually first. Use an automated tool to save time and catch zones you might miss — not as a replacement for understanding the underlying logic. If you can't explain why a zone should hold in your own words, you shouldn't trade it, regardless of what any indicator shows you.
The indicator also pairs well with Order Block Sniper Pro — order blocks and S&D zones are related concepts, and when they overlap, it creates confluence zones with the highest probability readings I've found on gold.
Putting It All Together: A Real Trade Scenario
Here's how a typical S&D trade looks in practice on my gold chart:
- H4 chart is bullish — I'm looking only for demand zones (buying opportunities).
- H1 shows a demand zone at 2680-2684 that formed after a sweep of previous swing lows. This is a Grade A zone.
- I switch to M5 and wait for price to approach 2684 from above.
- Price wicks below 2684 into 2680, then the candle closes at 2686 with a strong bullish body. Volume is elevated on this candle.
- I enter buy at the close of the confirmation candle. Stop loss at 2677 (30 pips below the zone low). TP1 at 2693 (risk:reward 1:1 for partial), TP2 at 2705 (next supply zone from H1).
- The EMA ribbon on M5 is flattening and starting to curl up — additional confirmation.
Not every trade works this cleanly. But the process is consistent, which means my results over time are consistent. The key is quality over quantity — I'd rather take three Grade A zone trades per week than ten Grade C trades.
Key Takeaway
Supply and demand zone trading isn't about drawing rectangles. It's about understanding why certain levels hold institutional significance and filtering out the noise. The difference between a professional S&D trader and an amateur is not the drawing tool — it's the context analysis.
Focus on fresh zones, look for liquidity sweeps, confirm with higher timeframe alignment, and treat each zone as single-use until proven otherwise. Do this consistently, and your zone-based trading accuracy will improve significantly within weeks.
Disclaimer: This article is educational content based on personal experience and is not financial advice. Supply and demand zone trading involves risk. Past results on historical charts do not guarantee future performance. Always practice on a demo account before risking real capital.