Gold on M5 is beautiful and brutal. One candle can move $3 with a massive wick, only for the next candle to reverse half of it. Standard Japanese candlesticks show you every bit of this chaos — every wick, every gap, every indecision candle. That's great for purists who want raw data. It's terrible for traders who need trend clarity.
I switched to Heiken Ashi candles on my gold scalping charts about eight months ago. Here's why, what I gained, what I lost, and when I still switch back to regular candles.
The Problem With Regular Candles on Gold M5
Gold is one of the noisiest instruments to scalp. On M5, during London session, you routinely see:
- Long-wicked doji candles that look bearish in an uptrend — creating false reversal signals
- Alternating red-green-red-green sequences during a clear directional move — making trend identification difficult
- Engulfing candles that suggest reversal but are actually just wider-than-average range candles in a trend
- Gaps between close and open of consecutive candles (more common during news) that make it hard to visually track the flow
The core issue: regular candles represent discrete 5-minute periods independently. Each candle's open is the actual market open of that period. This gives you accurate price data but poor visual flow. When you're trying to make a 30-second scalping decision, visual flow beats data accuracy.
How Heiken Ashi Actually Works
Heiken Ashi (Japanese for "average pace") modifies candlestick calculations to smooth out noise:
- HA Close = (Open + High + Low + Close) / 4 — average of the real OHLC
- HA Open = (Previous HA Open + Previous HA Close) / 2 — average of previous HA values
- HA High = Maximum of (High, HA Open, HA Close)
- HA Low = Minimum of (Low, HA Open, HA Close)
The critical difference is the HA Open. By averaging the previous candle's HA values, each new candle inherits information from the past. This creates the smoothing effect — a single counter-trend candle can't flip the HA color because it needs to overcome the averaged momentum of previous candles.
In practical terms: during a strong uptrend on gold, regular candles might show 7 green, 1 red, 3 green, 1 red, 4 green. Heiken Ashi would show 16 consecutive green candles because those 2 red candles weren't strong enough to overcome the averaged bullish momentum. The trend is the same — HA just makes it visible.
The 5-State Color System
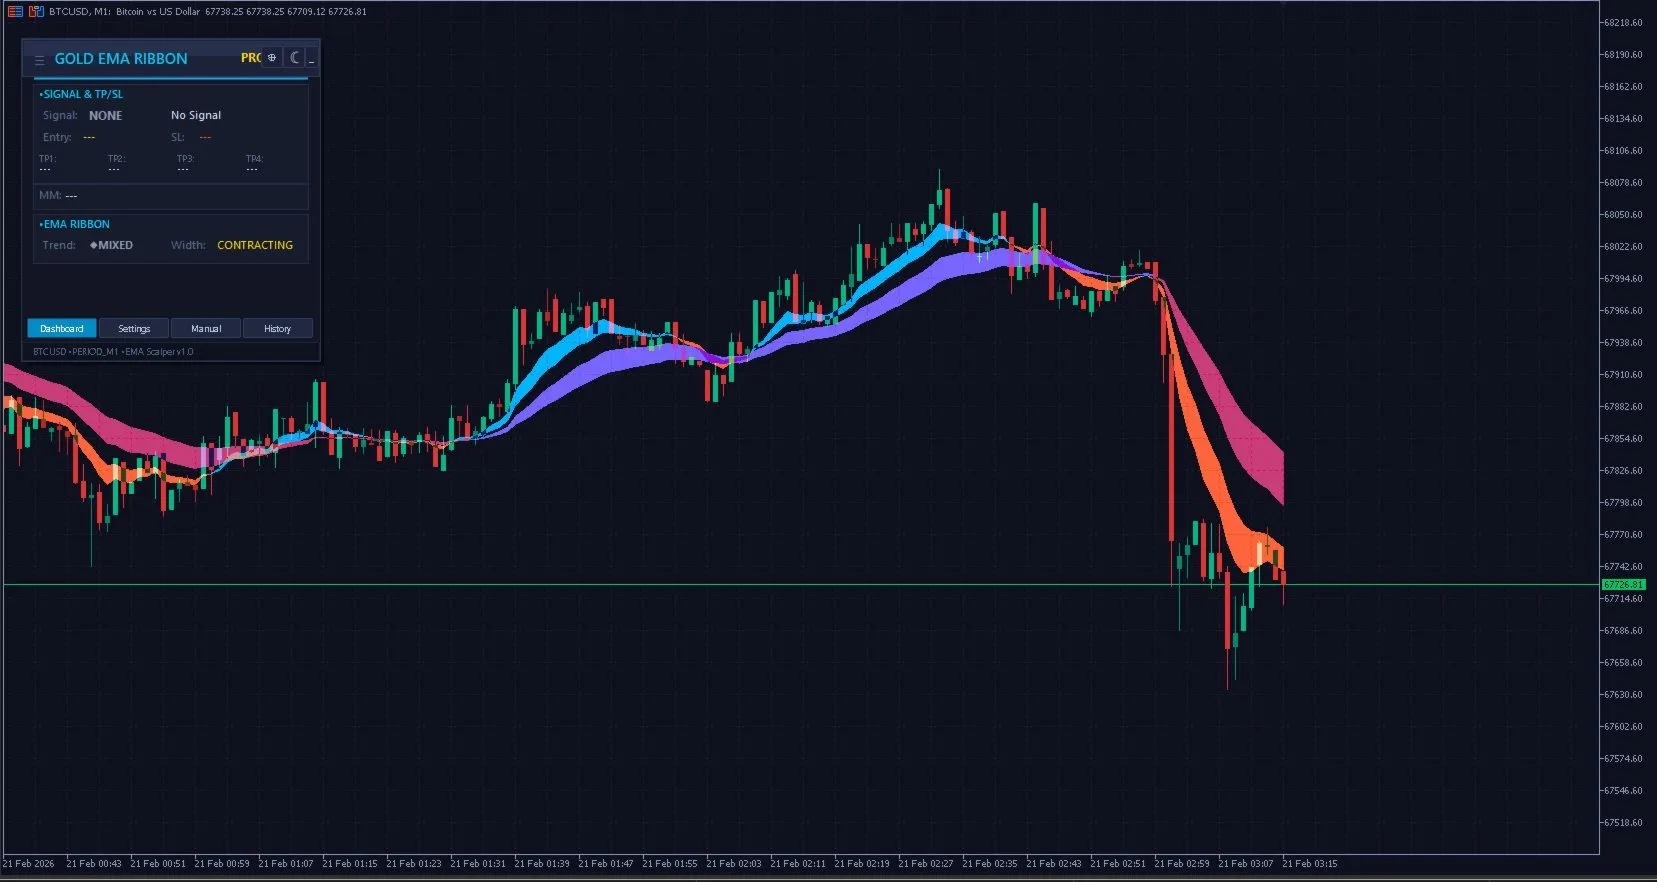
Standard Heiken Ashi uses two colors — bullish and bearish. My setup in Gold EMA Ribbon Scalper Pro uses five states, each with a distinct color:
- Strong Bullish (bright green) — HA body is bullish with no lower wick. This means the entire candle was bought — extremely strong upward momentum.
- Weak Bullish (muted green) — HA body is bullish but has a lower wick. Upward momentum with some selling pressure. Trend is still up but slowing.
- Neutral (gray) — small body, wicks on both sides. Transitional candle. No clear momentum in either direction.
- Weak Bearish (muted red) — HA body is bearish but has an upper wick. Downward momentum with some buying interest.
- Strong Bearish (bright red) — HA body is bearish with no upper wick. Pure selling pressure.
The power is in the transitions. A trend typically progresses: strong bullish → weak bullish → neutral → weak bearish → strong bearish. When you see the color shift from strong to weak, that's your early warning. When neutral appears, the trend is dying. You don't need to wait for a bearish engulfing pattern to tell you the uptrend is over — the color gradient tells you candles in advance.
Combining Heiken Ashi with EMA Ribbon
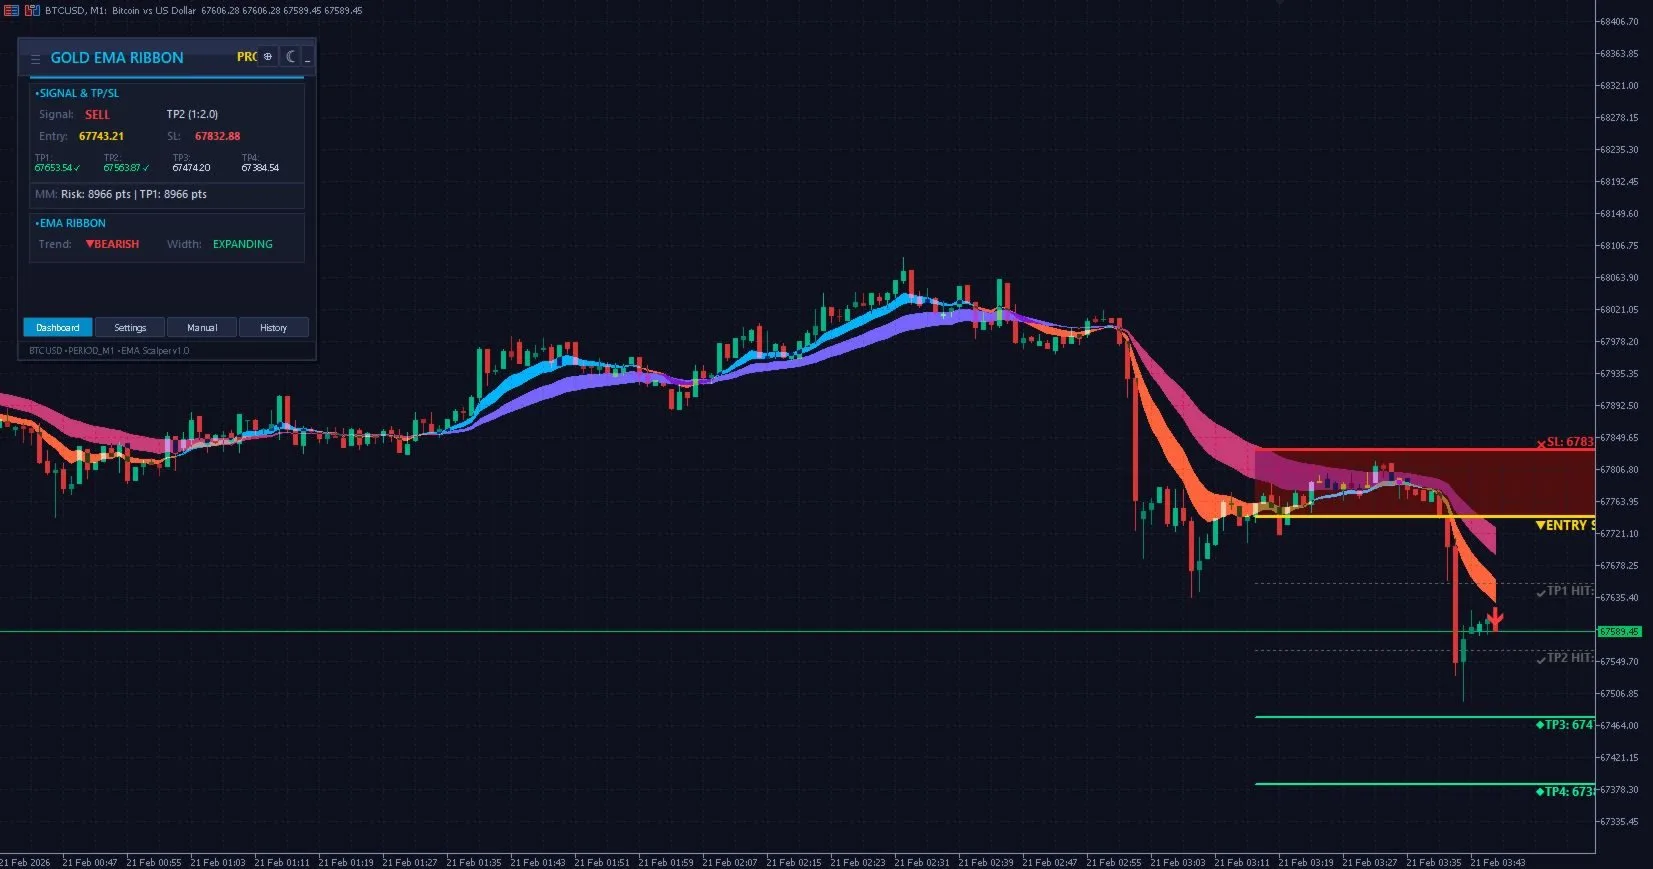
Heiken Ashi alone is a noise filter, not a signal system. I combine it with the 6-EMA ribbon cloud to get both trend clarity and entry/exit signals:
- Trend direction: EMA ribbon order (all 6 EMAs aligned) confirms the macro trend
- Trend strength: Heiken Ashi color state shows micro trend momentum
- Entry: I enter when HA turns strong bullish (green, no lower wick) after a pullback to the ribbon cloud
- Hold: I stay in while HA remains strong or weak bullish and price is above the fast EMA cloud
- Exit warning: HA transitions to neutral — I tighten my stop
- Exit: HA turns weak bearish — I close remaining position or let trailing stop handle it
The combination solves the main weakness of each tool individually. The EMA ribbon alone doesn't tell you about candle-level momentum — a ribbon can be bullish while candles are choppy. Heiken Ashi alone doesn't tell you about structural trend — HA can be green during a pullback within a bearish trend. Together, they give you complete trend information across two dimensions.
When NOT to Use Heiken Ashi
I switch back to regular candles in specific situations:
- When trading supply and demand zones — these require precise price action reading. HA smoothing hides the exact reaction at zone boundaries.
- When looking for pin bars or engulfing patterns — candlestick patterns require real OHLC data. HA modifies the open, so pattern recognition becomes unreliable.
- When setting exact SL/TP levels — I calculate stop loss based on real price levels (actual swing lows), not HA values. I view real candles for SL placement, then switch back to HA for trade management.
- During ranging markets — HA tends to show alternating colors faster than trending markets, which can generate false signals. In ranges, I prefer clean price action or zone-based trading.
The general rule: use HA for trend following and scalping with the trend. Use regular candles for reversal patterns and precise level identification.
The Psychological Benefit Nobody Talks About
Here's the underrated advantage of Heiken Ashi on gold: it reduces emotional exits.
With regular candles, you're in a long position, the trade is up $8, and suddenly a massive red M5 candle appears. Your adrenal glands fire. Your finger moves toward the close button. You close the trade in panic. Then the next candle is green, and the move continues another $15 in your original direction. You closed because a single candle scared you.
With Heiken Ashi, that same moment shows the HA candle transitioning from strong green to light green. Still bullish. The information is the same — there was selling pressure — but the visual representation keeps you calm. You stay in, and you catch the continuation.
I've tracked my trades before and after switching to HA. My average hold time increased by about 40%. Not because I'm taking longer trades, but because I stopped cutting winners short on noise candles. The exit strategy became more systematic and less emotional.
Practical Settings for Gold Scalping
My Heiken Ashi configuration for XAUUSD M5:
- Mode: 5-color state (not standard 2-color)
- Strong bullish color: RGB(0, 255, 200) — cyan/aqua for maximum visibility on dark chart
- Weak bullish: RGB(30, 160, 80) — darker green
- Neutral: RGB(88, 96, 125) — gray-blue
- Weak bearish: RGB(200, 110, 30) — orange
- Strong bearish: RGB(255, 45, 80) — bright red
- EMA periods: 8, 13, 21, 34, 55, 89 (Fibonacci ribbon)
- Cloud fill: 3-layer gradient with HA-colored fill
The color choices matter — strong bullish and strong bearish should be the most vivid, eye-catching colors. Weak states should be muted. Neutral should be nearly invisible. This creates a natural visual hierarchy where your eye immediately catches the strong momentum states.
A Word of Caution
Heiken Ashi is a visualization tool, not a magic filter. It will not turn a losing strategy into a winning one. What it does is reduce the visual noise that leads to impulsive decisions — entering too early, exiting too late, or second-guessing a valid signal.
If your current gold scalping approach doesn't work with regular candles, it won't work with HA either. Fix the strategy first — proper risk management, session timing, multi-timeframe alignment. Then add HA as the visual layer that makes execution smoother.
For me, the switch to Heiken Ashi was like putting on noise-canceling headphones in a busy room. The market is still the same market. I just stopped hearing the static.
Heiken Ashi vs Renko vs Range Bars: Which Noise Filter Is Best?
Heiken Ashi isn't the only noise reduction technique. Traders also use Renko charts and Range bars. Here's how they compare for gold scalping:
- Heiken Ashi — modifies candlestick calculations while keeping the time axis intact. Each candle still represents exactly 5 minutes (on M5). You can combine HA with time-based indicators like session filters and news timing. Your EMA ribbon, RSI, and other indicators work normally. Best for: traders who need both noise reduction and time-based analysis.
- Renko — removes the time axis entirely. New bricks only form when price moves a set number of pips (e.g., 30 pips). This creates extremely clean trends but eliminates time context. You can't see session boundaries, your indicators recalculate on irregular intervals, and you lose the ability to time entries around London open or news events. Best for: pure trend-following on higher timeframes where session timing doesn't matter.
- Range Bars — similar to Renko but each bar represents a fixed price range rather than a fixed pip movement. Wicks are possible (unlike Renko). Better than Renko for seeing rejection, but still removes the time axis. Best for: swing traders who want cleaner candles without caring about session timing.
For gold scalping specifically, I prefer Heiken Ashi because session timing is critical. Knowing whether I'm in the London kill zone or late New York session fundamentally changes how I interpret signals. Renko and Range bars destroy that context. HA preserves it while still giving me the smooth, color-coded trend clarity I need for quick decisions.
Heiken Ashi Backtesting Considerations
One important caveat: if you're backtesting a strategy that uses Heiken Ashi signals, remember that HA values are calculated differently from real OHLC. Your entry and exit prices in the backtest should be based on real prices, not HA prices.
Why? HA Open doesn't match the real candle open. If your EA enters at the HA Open, it's entering at a price that may be significantly different from the actual market price. This creates phantom P&L — profits or losses that couldn't have been achieved in real trading.
The correct approach: use HA for signal generation (when to enter/exit based on color transitions), but use real prices for order execution (the actual entry/exit levels). Gold EMA Ribbon Scalper Pro handles this correctly — HA colors drive the signal logic, but all price calculations use real OHLC data.
Frequently Asked Questions
Are Heiken Ashi candles good for gold trading?
Yes, especially for scalping on M5 and M15 timeframes. Gold (XAUUSD) is one of the noisiest instruments to trade — large wicks, erratic intrabar movements, and frequent false reversals during strong trends. Heiken Ashi smooths this noise by averaging price data, making trend direction and strength visually clear. I've used HA for gold scalping for over 8 months and my average hold time increased ~40% because I stopped cutting winners short on noise candles.
What is the difference between Heiken Ashi and regular candlesticks?
Regular (Japanese) candlesticks use the actual Open, High, Low, Close of each time period. Heiken Ashi modifies the calculation: the HA Close is the average of OHLC, and the HA Open is the average of the previous HA candle's open and close. This creates a smoothing effect where single counter-trend candles can't flip the color. The High and Low remain real extremes, so you still see the actual price range — but the body shape and color are smoothed.
Can I use Heiken Ashi for stop loss and take profit levels?
No — always use real price levels for SL/TP placement. HA modifies the open price, so placing your stop loss at an HA low means you're targeting a synthetic price that doesn't actually exist in the market. I use real candle swing lows/highs for stop loss placement and ATR-based calculations for take profit. Use HA only for signal generation and trade management decisions (when to tighten stops, when to exit).
Does Heiken Ashi work on all timeframes?
It works on all timeframes but the benefit varies. On very low timeframes (M1), HA still shows frequent color changes because even averaged data can't fully smooth tick-by-tick noise. On very high timeframes (Daily, Weekly), regular candles are already relatively smooth, so HA adds less value. The sweet spot is M5 to H1 — timeframes with enough noise to benefit from smoothing but short enough for the smoothing to make a meaningful difference in your decision-making speed.
What is the 5-state Heiken Ashi color system?
Standard HA uses two colors: bullish and bearish. The 5-state system adds granularity: Strong Bullish (no lower wick — pure buying), Weak Bullish (has lower wick — buying with some selling pressure), Neutral (small body, wicks both sides — indecision), Weak Bearish (has upper wick), and Strong Bearish (no upper wick — pure selling). The 5-state system lets you see trend transitions before they complete — moving from "strong" to "weak" is an early warning that traditional 2-color HA misses.
Can I combine Heiken Ashi with other indicators?
Absolutely — and you should. HA alone is a visualization tool, not a complete strategy. I combine it with a 6-EMA ribbon for trend structure, RSI for momentum, and ATR for volatility context. The key constraint: indicators that rely on candle patterns (like engulfing, pin bar, or doji detection) don't work reliably with HA because the modified open changes the candle shapes. Use HA with mathematical indicators (EMA, RSI, MACD, ATR) rather than pattern-based ones.
Disclaimer: This article describes my personal experience and is not financial advice. Heiken Ashi candles modify price visualization and may affect strict SL/TP accuracy. Trading gold involves significant risk. Always test on a demo account first.